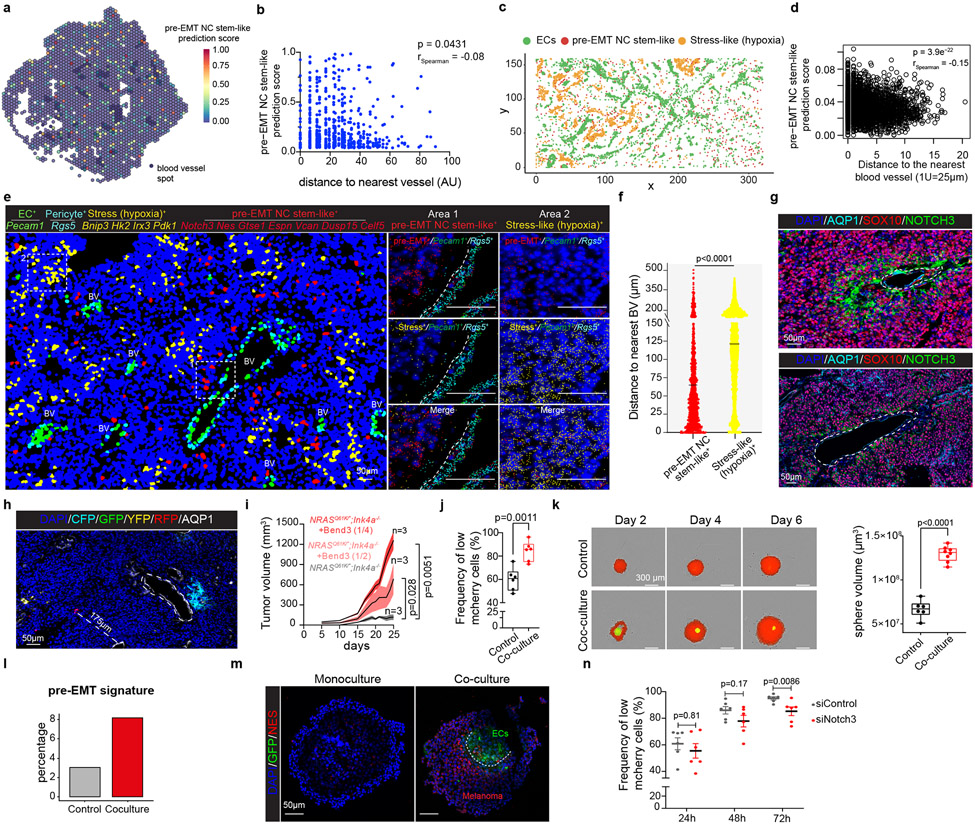
Figure 3: A perivascular niche promotes melanoma growth.
a, Quantification of pre-EMT NC stem-like activity onto spatial transcriptomics. Dark blue, BVs annotation. b, Inverse correlation (Spearman) between the pre-EMT NC stem-like cell prediction score and distance to nearest BV. c, Spatial scatter plot shows bins of EC, pre-EMT NC stem-like and hypoxia (binary AUCell score). d, Anti-correlation (Spearman) of pre-EMT NC stem-like activity (AUCell score) and distance to closest BV. e, Molecular cartography for the indicated genes. Left, pseudocolored cells based on the type/state identity (n=33 ROIS). Insets, areas enriched either for pre-EMT NC stem-like (Area 1) or stress-hypoxia cells (Area 2). f, Median distance to nearest BV (n=33 ROIs; p<0.0001). g, Immunostaining for indicated proteins. Upper, a capillary; lower, a dilated tumour BV (n=3 tumors). h, Confocal image of Confetti+ tumours (n=6), immunostained for AQP1. i, DsRed-labeled melanoma cells injected into immunocompromised mice alone or with GFP-labeled Bend3 ECs (ratio 1/2; p= 0.0281 and ratio 1/4; p=0.0051). Tumour volume (mean±SEM) in function of time/days (n=3). j, Percentage of mCherry high versus low watermelon+ cells cultured alone or with Bend3 (n=6, p=0.0011). k, Left, melanospheres (DsRed-labeled) grown alone or with (GFP-labeled) Bend3 ECs. Right, melanosphere volume (n=6 monoculture, n=8 co-culture; p<0.0001). l, Melanoma cells cultured alone (Control) or with Bend3 cells and percentage of malignant cells harbouring the pre-EMT NC stem-like state (binary AUCell score) determined by scRNA-seq. m, Representative images of melanospheres (n=2) grown alone or with GFP-labeled Bend3. The presence of NES+ cells was evaluated. n, Doxycycline induced watermelon+ cells transfected with siControl or siNotch3 supplemented with Bend3 cells. b and d, Fisher exact test, two-tailed p value. f, i and n, two-tailed Mann-Whitney Test. In j and k, boxes extend from the 25th to 75th percentile, middle line represents the median. Whiskers represent min to max values (unpaired two-tailed Student’s t test with Welch’s correction).

