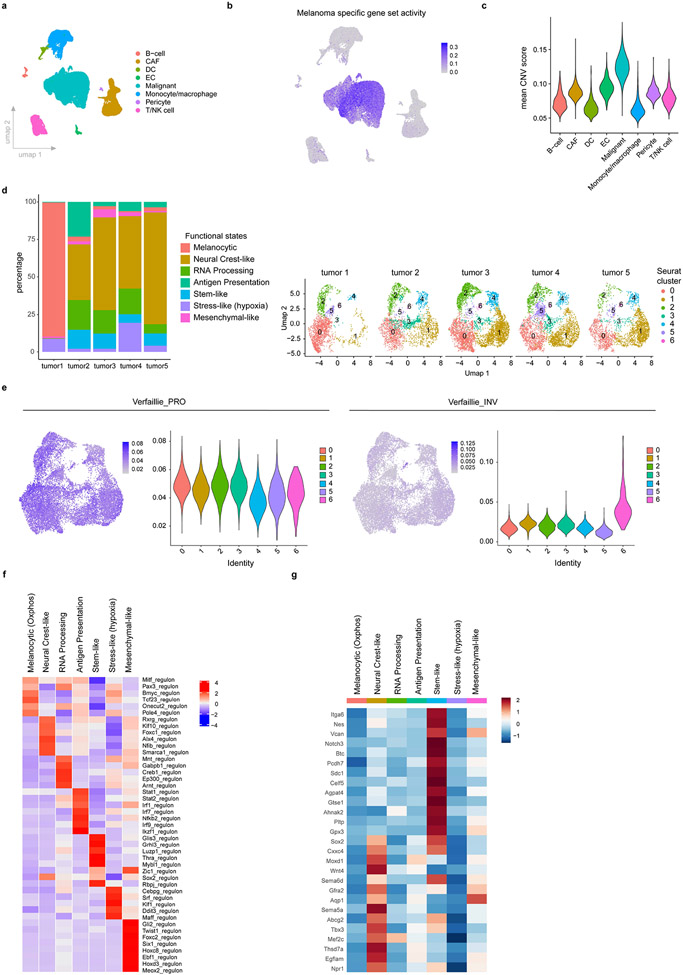
Extended Data Fig. 1: Cellular composition and discriminative regulons of NRAS-driven mouse melanoma.
a, UMAP illustrating cell type diversity in NRASQ61K/°;Ink4a−/− lesions (43k cells). b, Activity (AUCell score) of a melanoma specific gene set5 in NRASQ61K/°;Ink4a−/− lesions. c, Violin plot depicting mean Copy Number Variation (CNV) scores for the different cell types, including the malignant compartment, identified in NRASQ61K/°;Ink4a−/− lesions. d, Relative proportions of the melanoma transcriptional cell states highlighting a strong representation across all 5 NRASQ61K/°;Ink4a−/− tumors, illustrated as stacked bar (left panel) and as UMAP (right panel). e, Proliferative (PRO or melanocytic) and invasive (INV or mesenchymal-like) gene sets34 activity (AUCell score) in all mouse malignant cells (umap plots, left panel) or per transcriptional state (violin plots, right panel). f, Heatmap depicts changes in regulon activities for seurat clusters described in NRASQ61K/°;Ink4a−/− lesions g, Heatmap depicting average expression of selected Neural Crest Stem Cell (NCSC) and pre-migratory (pre-EMT) Neural Crest markers.

