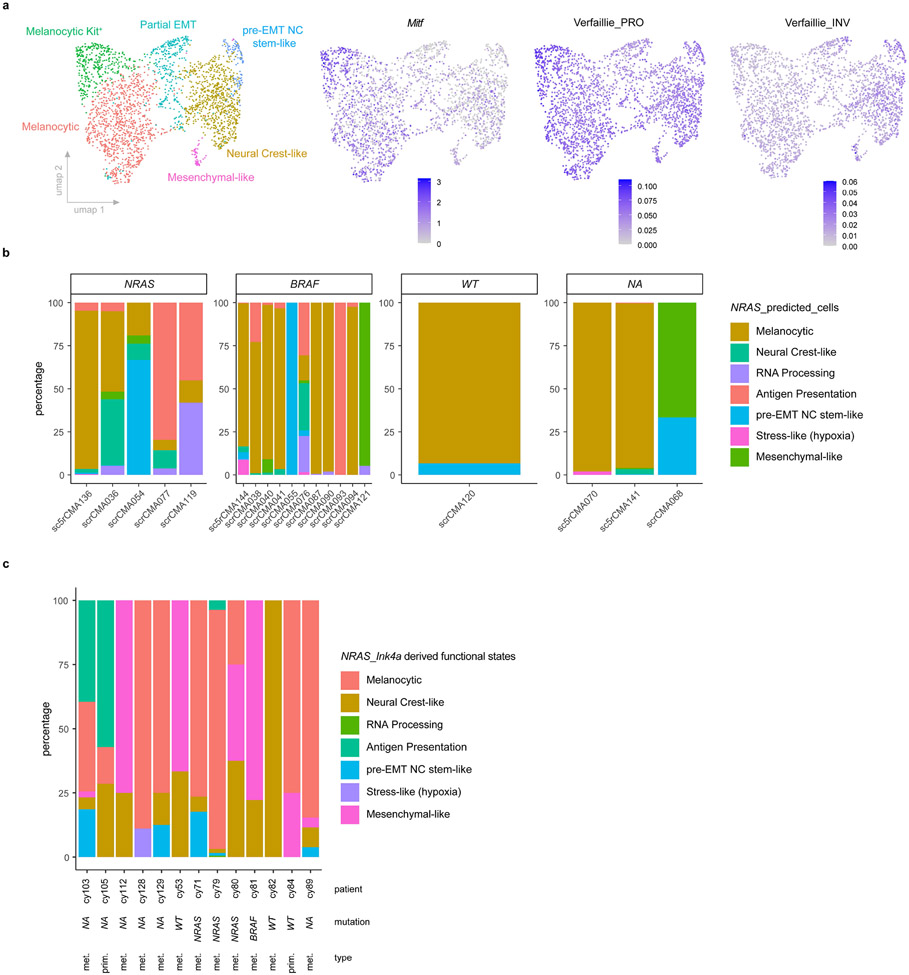
Extended Data Fig. 2: Single-cell transcriptomic landscape in BRAF-mutant mouse and human melanoma lesions.
a, UMAP visualisation of >2.600 malignant cells analysed by scRNA-seq and integrated across 2 different BRAFV600E;Ptenl/l lesions. The Seurat clusters were annotated using signature-based annotation (left panel). Mitf expression and Proliferative (PRO or Melanocytic) and invasive (INV or mesenchymal-like) gene sets35 activity (AUCell score) across all malignant cells (right panels). b, Stacked bar chart illustrating the distribution of malignant cell states (binary cut-offs) extracted from NRASQ61K/°;Ink4a−/− and projected onto scRNAseq data of drug naive human melanoma lesions. Each graph is categorized based on the main genetic driver mutations identified. WT indicates lesions that do not carry BRAF neither NRAS mutations; N/A indicates lesions for which genetic information is lacking. c, Stacked bar chart illustrating the distribution of malignant cell states (binary cut-offs) extracted from NRASQ61K/°;Ink4a−/− lesions and projected onto a publicly available scRNA-seq dataset (malignant treatment-naïve cells) of human melanoma biopsies11. The patient IDs and main genetic driver mutations are indicated. WT indicates lesions that do not carry BRAF neither NRAS mutations; N/A indicates lesions for which genetic information is lacking; met. stands for metastatic and prim. for primary lesions.

