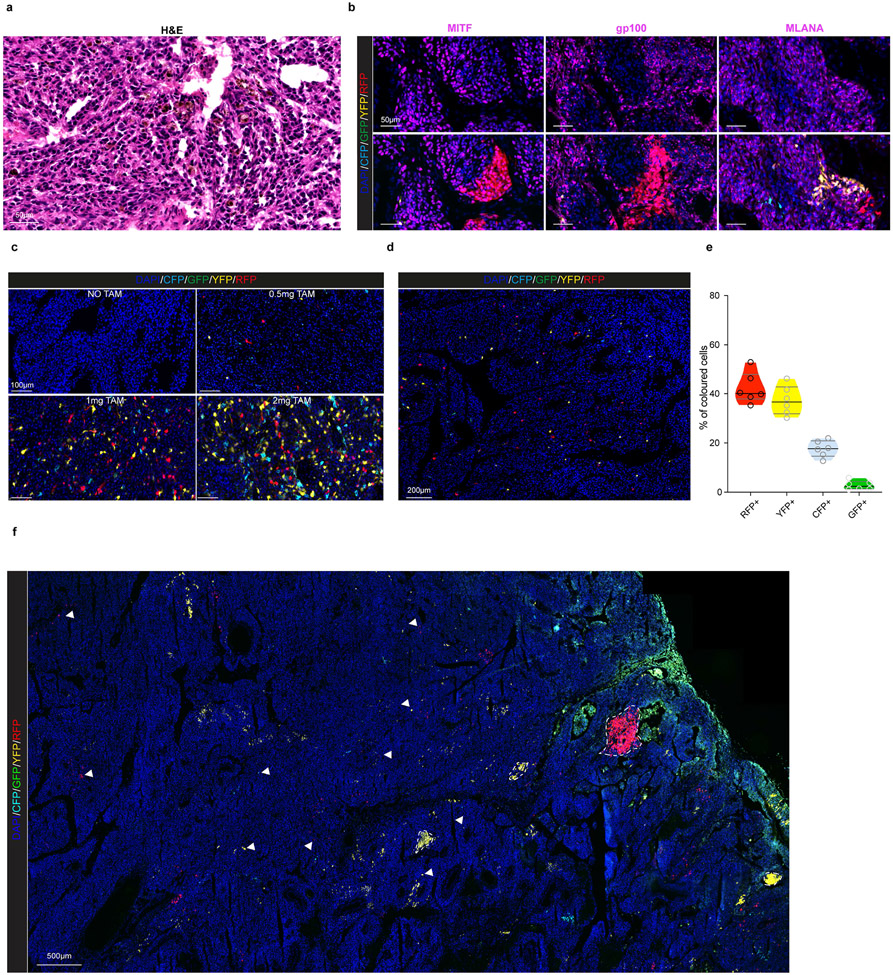
Extended Data Fig. 3: Characterization of the Confetti melanoma mouse model.
a, H&E staining of melanoma model Tyr::NRASQ61K/°;Ink4a−/−;Tyr::CreERT2/°;Rosa26-LSL-Confetti+/+. Representative image from n=3 independent tumors. b, Confocal images of labeled melanoma subclones acquired by confocal imaging upon TAM administration and immunostained for melanocytic lineage markers MITF, gp100 and MLANA (magenta) exhibiting heterogeneous expression. Images from n=4 independent tumors. c, Representative confocal images showing Confetti labelling efficiency in melanoma tumours 3 days after the administration of different doses of TAM in order to achieve the optimal dose to perform clonal analyses. Images from n=4 independent experiments. d, Representative confocal images showing Confetti labelling of melanoma cells 5 days after TAM administration (0.5 mg). Images from n=6 independent tumors. e, Violin plot depicting the proportion of labelled melanoma cells expressing each Confetti fluorophore 5 days after TAM administration (0.5 mg). Six melanoma tumours (two sectional areas of each) were analysed. Black line represents median and grey lines the 25th to 75th percentile. f, Representative confocal image at low magnification illustrating the clone size heterogeneity in tumours that have expanded 10-fold from the initial size after TAM administration (0.5 mg). Arrowheads show several single and/or oligoclones that exhibit minor expansion over time. Images from n=8 independent tumors.

