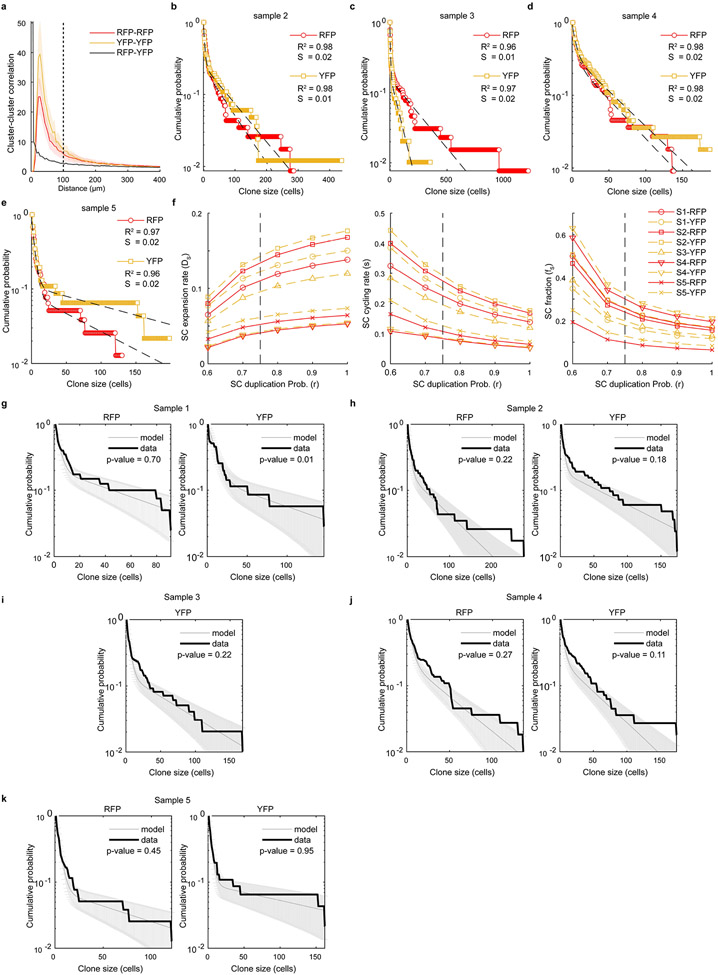
Extended Data Fig. 4: Clone size distributions are consistent with the hierarchical model.
a, Cluster-cluster distance correlation indicating a high likelihood that clusters of a given colour are found near clusters of the same colour for distances below 100 μm. This threshold, indicated by a dashed line, was then used in the association of clones. Solid line and shaded area correspond to mean and ±SEM for n=5 biological repeats. b-e, Cumulative distribution (CDF) of clone sizes for YFP+ and RPF+ cells in samples 2-5 (for number of clones per sample see Supplementary Table 5) Sample 1 is presented in Fig. 2f. The dashed black lines correspond to the bi-exponential fits of the data, as predicted by the hierarchical model, for each dataset we show the R-squared (R2) and standard error of the fit (S) of the theoretical CDFs to the data. f, Sensitivity of the stem cell expansion rate, cycling rate and stem cell fraction to different choices of the stem cell symmetric division probability, r. The vertical dotted line indicates the value r=0.75 used here to estimating the model parameters (see Supplementary Table 5). g-k, Comparison of the empirical CDFs of clone sizes for each of the n=5 biological repeats and the corresponding distributions and SD obtained from performing 10.000 stochastic simulations of the two-compartment stem-progenitor cell model using the parameters in Supplementary Table 5. The p-values from two-sample Kolmogorov-Smirnov tests comparing the empirical and numerical distribution of clone sizes are shown. In f and i, the RFP channel of sample 3 is not shown as it was considered to be below the threshold of clonality. For Extended Data Fig.5 see Supplementary Note in Supplementary Information).

