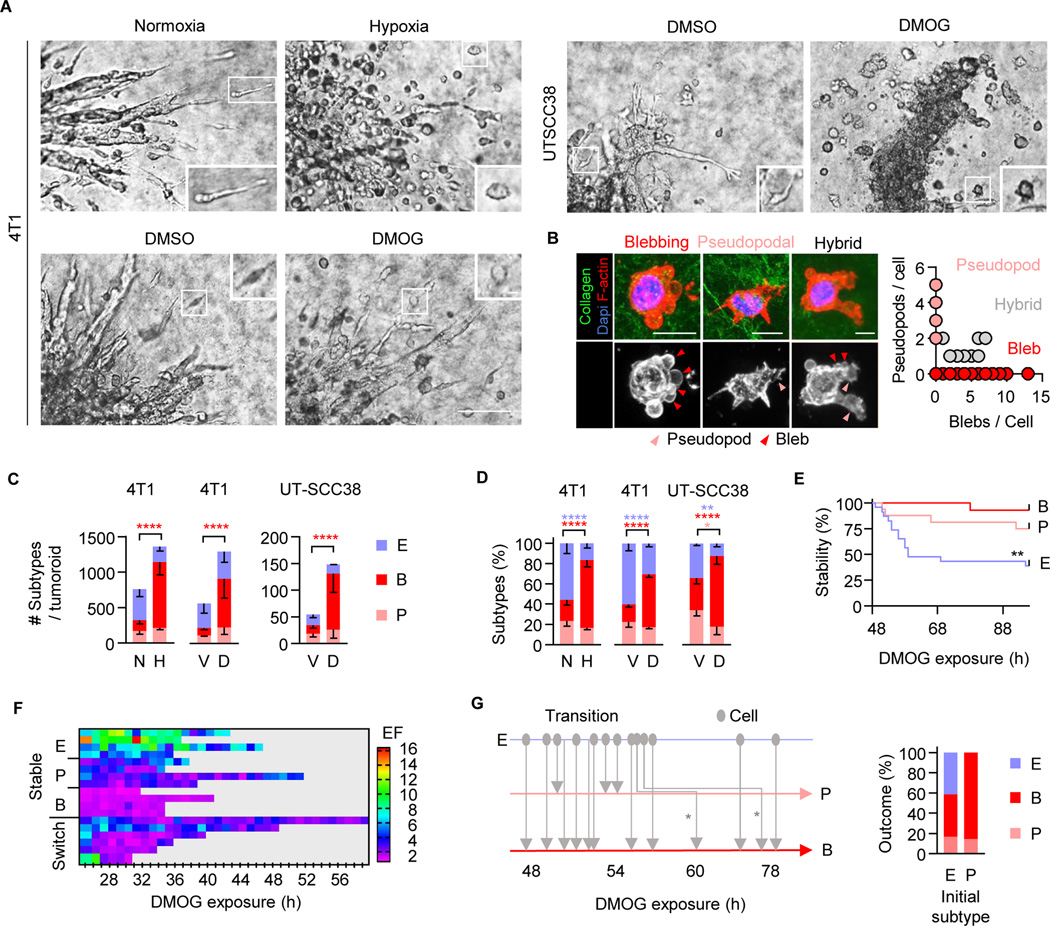
Figure 1. Hypoxia/HIF-induced amoeboid blebbing migration and cell viability.
A, Brightfield micrographs of tumoroids invading into collagen at 72 h (4T1) and 96 h (UT-SCC38) under the conditions indicated. Insets, individually migrating cells. Scale bars, 100 μm (overviews), 10 μm (insets). B, Representative confocal micrographs of UT-SCC38 cells 96 h after HIF-stabilization (left panels; scale bar, 10 μm). Protrusion type and number upon HIF stabilization (right panel; 44 cells, n=3). C, Morphology-based subtypes after 72 h (4T1) or 96 h (UT-SCC38). For classification criteria see STAR methods. Means ± s.d. of absolute cell number per subtype and tumoroid (5 tumoroids/experiment, n=3). **** P<0.0001 (two-way ANOVA). D, Frequency of single-cell migration subtypes per tumoroid. Means ± s.d. (5 tumoroids/experiment, n=3). **** P<0.0001, ** P<0.002, * P=0.015 (two-way ANOVA). E, Time-dependent phenotype of migrating 4T1 cells (time-lapse microscopy, 48 h observation period). Migration modes were classified for 3-h time windows. Data show 23 (E), 16 (P) and 13 (B) cells from 10 tumoroid quadrants. ** P=0.002 (Log-rank test). F, Time-dependent elongation of individual 4T1 cells. Elongation factor (EF) was detected at 1-h intervals for the duration that cells were detectable after detachment (8–24h). One cell per row. G, Time-dependent direct or step-wise (asterisks) transitions between migration modes (left panel) and aggregated phenotypes scored 48– 72 h after HIF-stabilization (right panel; 38 cells). Abbreviations: E, elongated; P pseudopodal-rounded; B, blebbing-rounded; N, normoxia; H, hypoxia; V, vehicle control (DMSO); D, DMOG.

