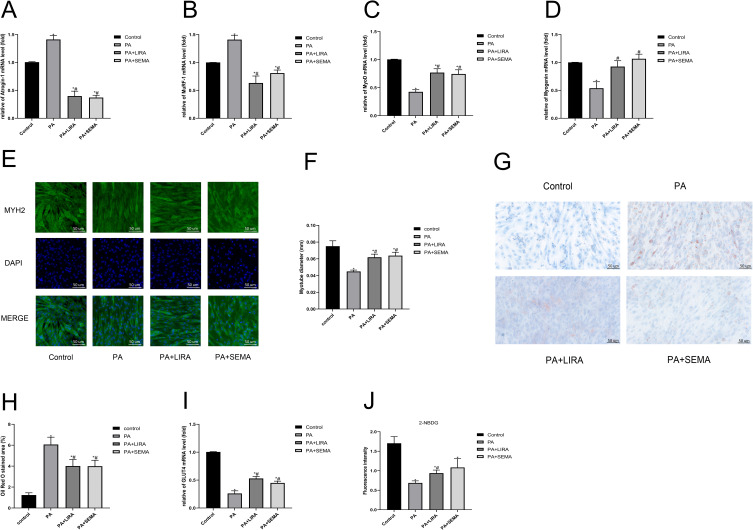
Figure 4.
Liraglutide and semaglutide alleviated PA induced muscle atrophy, lipid accumulation, and insulin resistance in C2C12 myotubes. (A) The mRNA level of Atrogin-1 was measured by qRT-PCR. (B) The mRNA level of MuRF-1 was measured by qRT-PCR. (C) The mRNA level of MyoD was measured by qRT-PCR. (D) The mRNA level of Myogenin was measured by qRT-PCR. (E) Representative images of MYH2 immunofluorescence in C2C12 myotubes (scale bar = 50 μm). (F) The diameter of myotubes. (G) Representative images of lipid accumulation in C2C12 myotubes stained with oil red O (scale bar = 50 μm). (H) The Oil red staining area. (I) The mRNA level of GLUT4 was measured by qRT-PCR. (J) The fluorescence intensity of 2-NBDG glucose uptake. *P < 0.05 compared with the control group, #P < 0.05 compared with the PA group.

