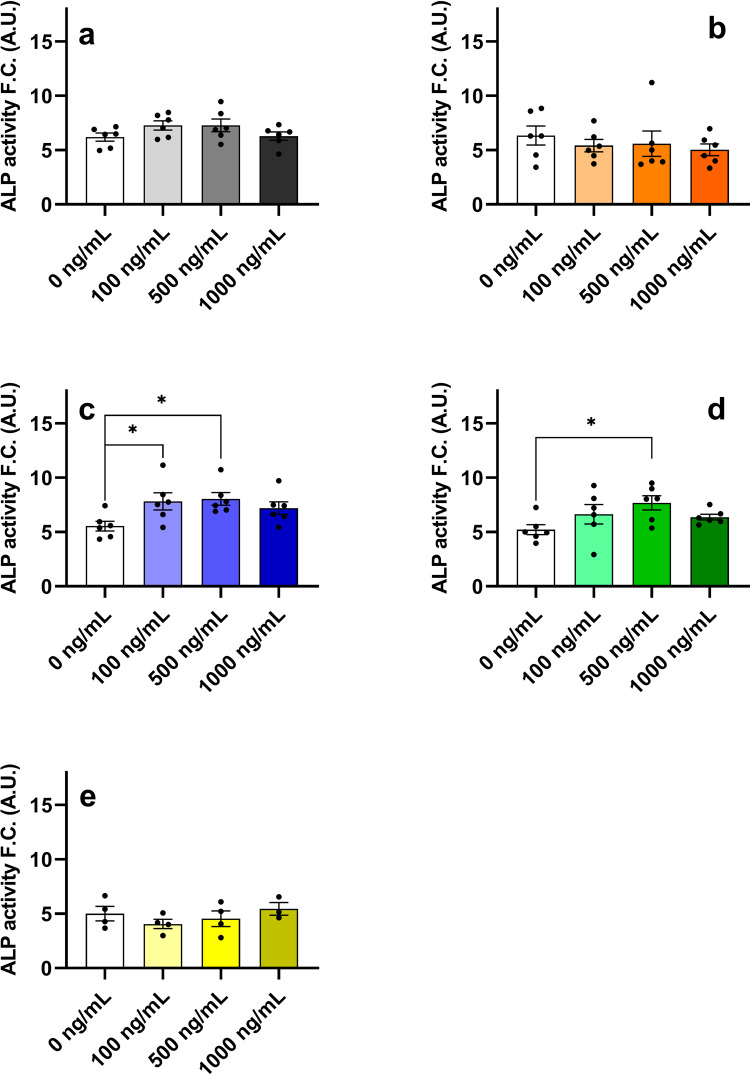
Fig. 8. Differentiation of hBMSC-TERT osteoblasts after treatment with IGF2 proforms.
IGF2 (a), big-IGF2(87) (b), big-IGF2(104) (c), pro-IGF2(156) (d), and gly pro-IGF2(156) (e). The data were evaluated using quantification of alkaline phosphatase (ALP) activity, normalized to cell viability presented as a fold change (F.C.) over non-induced cells (day 8), n = 2 independent experiments with 6 replicates (only gly pro-IGF2(156) with 4 replicates). Data are presented as mean ± SEM (n = 6 (or 4) per group), Ordinary one-way ANOVA (Dunnett´s multiple comparisons test), *p < 0.05, **p < 0.01, ****p < 0.0001. A.U. means arbitrary units.

