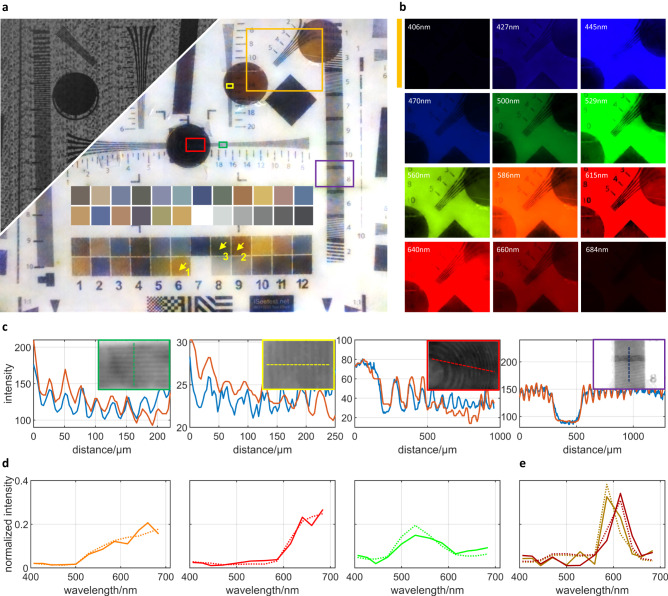
Fig. 2. The spatial and spectral resolution.
a The encoded measurement and the synthesized RGB image corresponding to the reconstructed multi-spectral data of the 2000-line resolution test target. The upper color checker area presents the ground truth of the color checker area under the response function of the adopted sensor. b Multi-spectral reconstruction result of the region marked in orange box in (a), colored by the RGB value of the corresponding wavelength. c The spatial line profiles for four regions on the resolution target, highlighted in green, yellow, red and purple boxes in (a), respectively. The orange lines represent the reconstructed results, and the blue lines the ground truth. d The spectral profiles for three spatial points marked by the yellow arrows in the color checker area in (a), plotted in orange, red and green lines, respectively. e The average spectral profiles for the two narrow-band spectral filters with adjacent transmission wavebands in the orange box in (a), marked in brown and red, respectively. In both (d) and (e), the solid lines represent the reconstructed results, and the dotted lines the ground truth.

