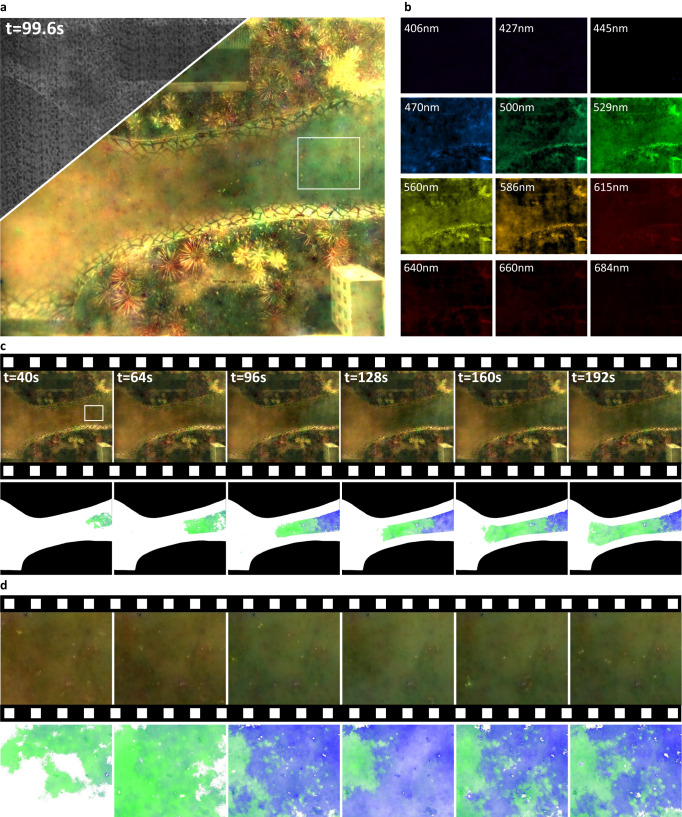
Fig. 4. Multi-spectral imaging of the diffusion process of sewage in a miniature landscape of a river.
a The encoded measurement (upper left corner) and RGB synthesized result at t = 99.6 s. b Multi-spectral reconstruction result at t = 99.6s, colored by the RGB value of the corresponding wavelength. c RGB synthesized time-lapse images and the corresponding heatmap generated from the multi-spectral data, showing the process of sewage diffusion. The brightness of the green and blue colors represent the concentration of the two types of sewage. d RGB synthesized time-lapse images and the corresponding heatmap for the region in white box in (a).

