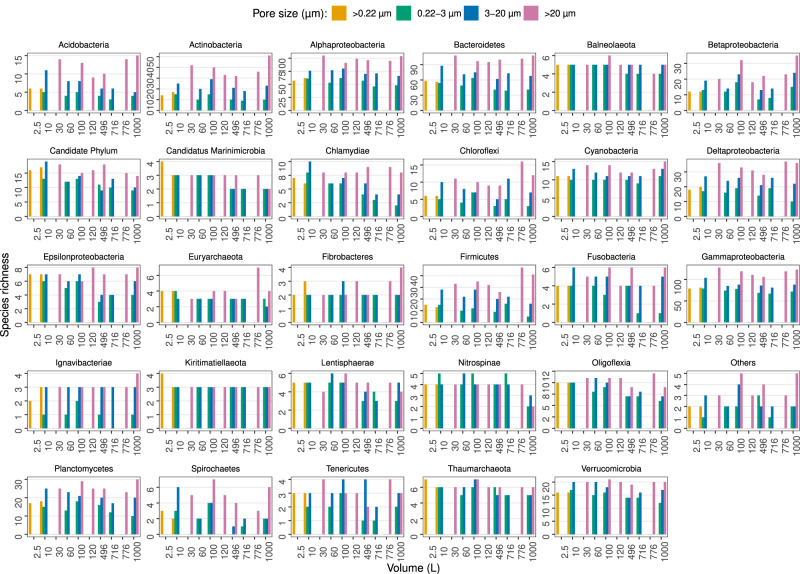
Fig. 5. Prokaryotic species richness per taxonomic group, from MetaB16SV4V5.
Each panel represents the species richness of a specific prokaryotic phyla or class for each volume (1–1000 L). Bar plots indicate species richness and are colored by pore size. The taxonomic group called “Others” includes all phyla that didn’t reach, at least, 100 taxonomic lineages across all samples, to avoid an excessive amount of uninformative, redundant panels. The taxonomic group called “Candidate Phylum” includes all phyla with candidate designation, except for candidate phyla Marinimicrobia.

