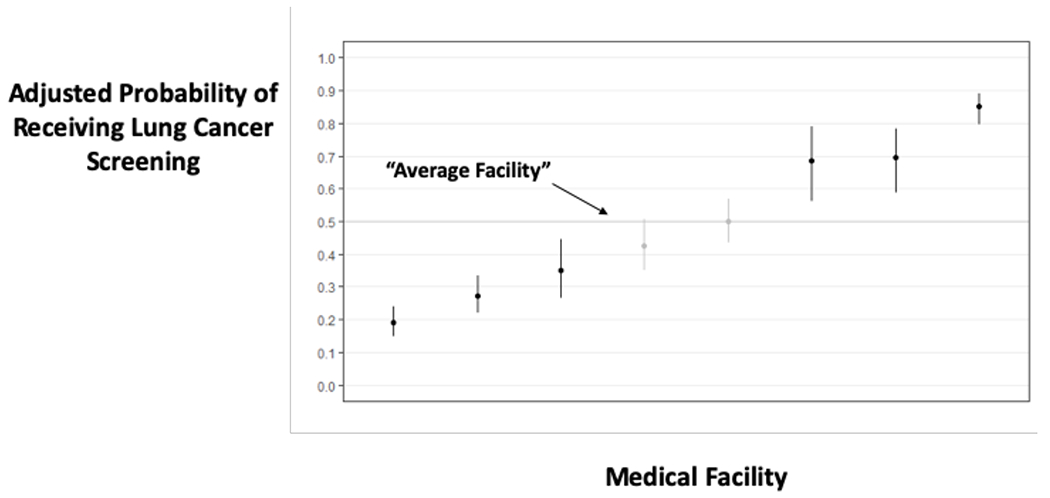
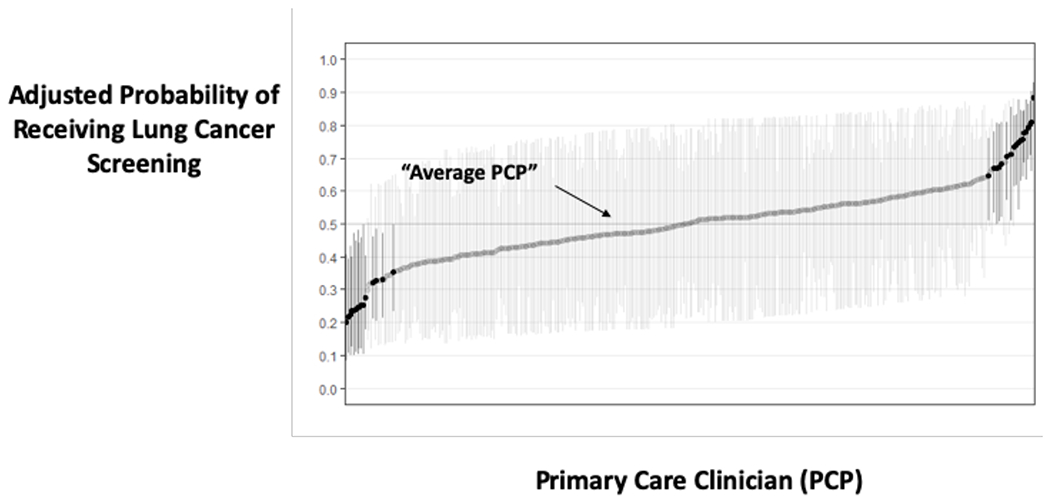
Figure 3: Variation in Receiving Lung Cancer Screening due to Medical Facility and Primary Care Provider.


a: Displays the adjusted predicted probability of receiving screening within 3 months of initial decision making, by site. An average site has an adjusted probability of 50%. Sites with darker CI’s in the plot have significantly different adjusted rates of receiving screening compared to an average site.
b: Displays the adjusted predicted probability of receiving screening within 3 months of initial decision making, by primary care clinician (PCP). An average PCP has an adjusted probability of 50%. PCP’s with darker CI’s in the plot have significantly different adjusted rates of receiving screening compared to an average PCP.
