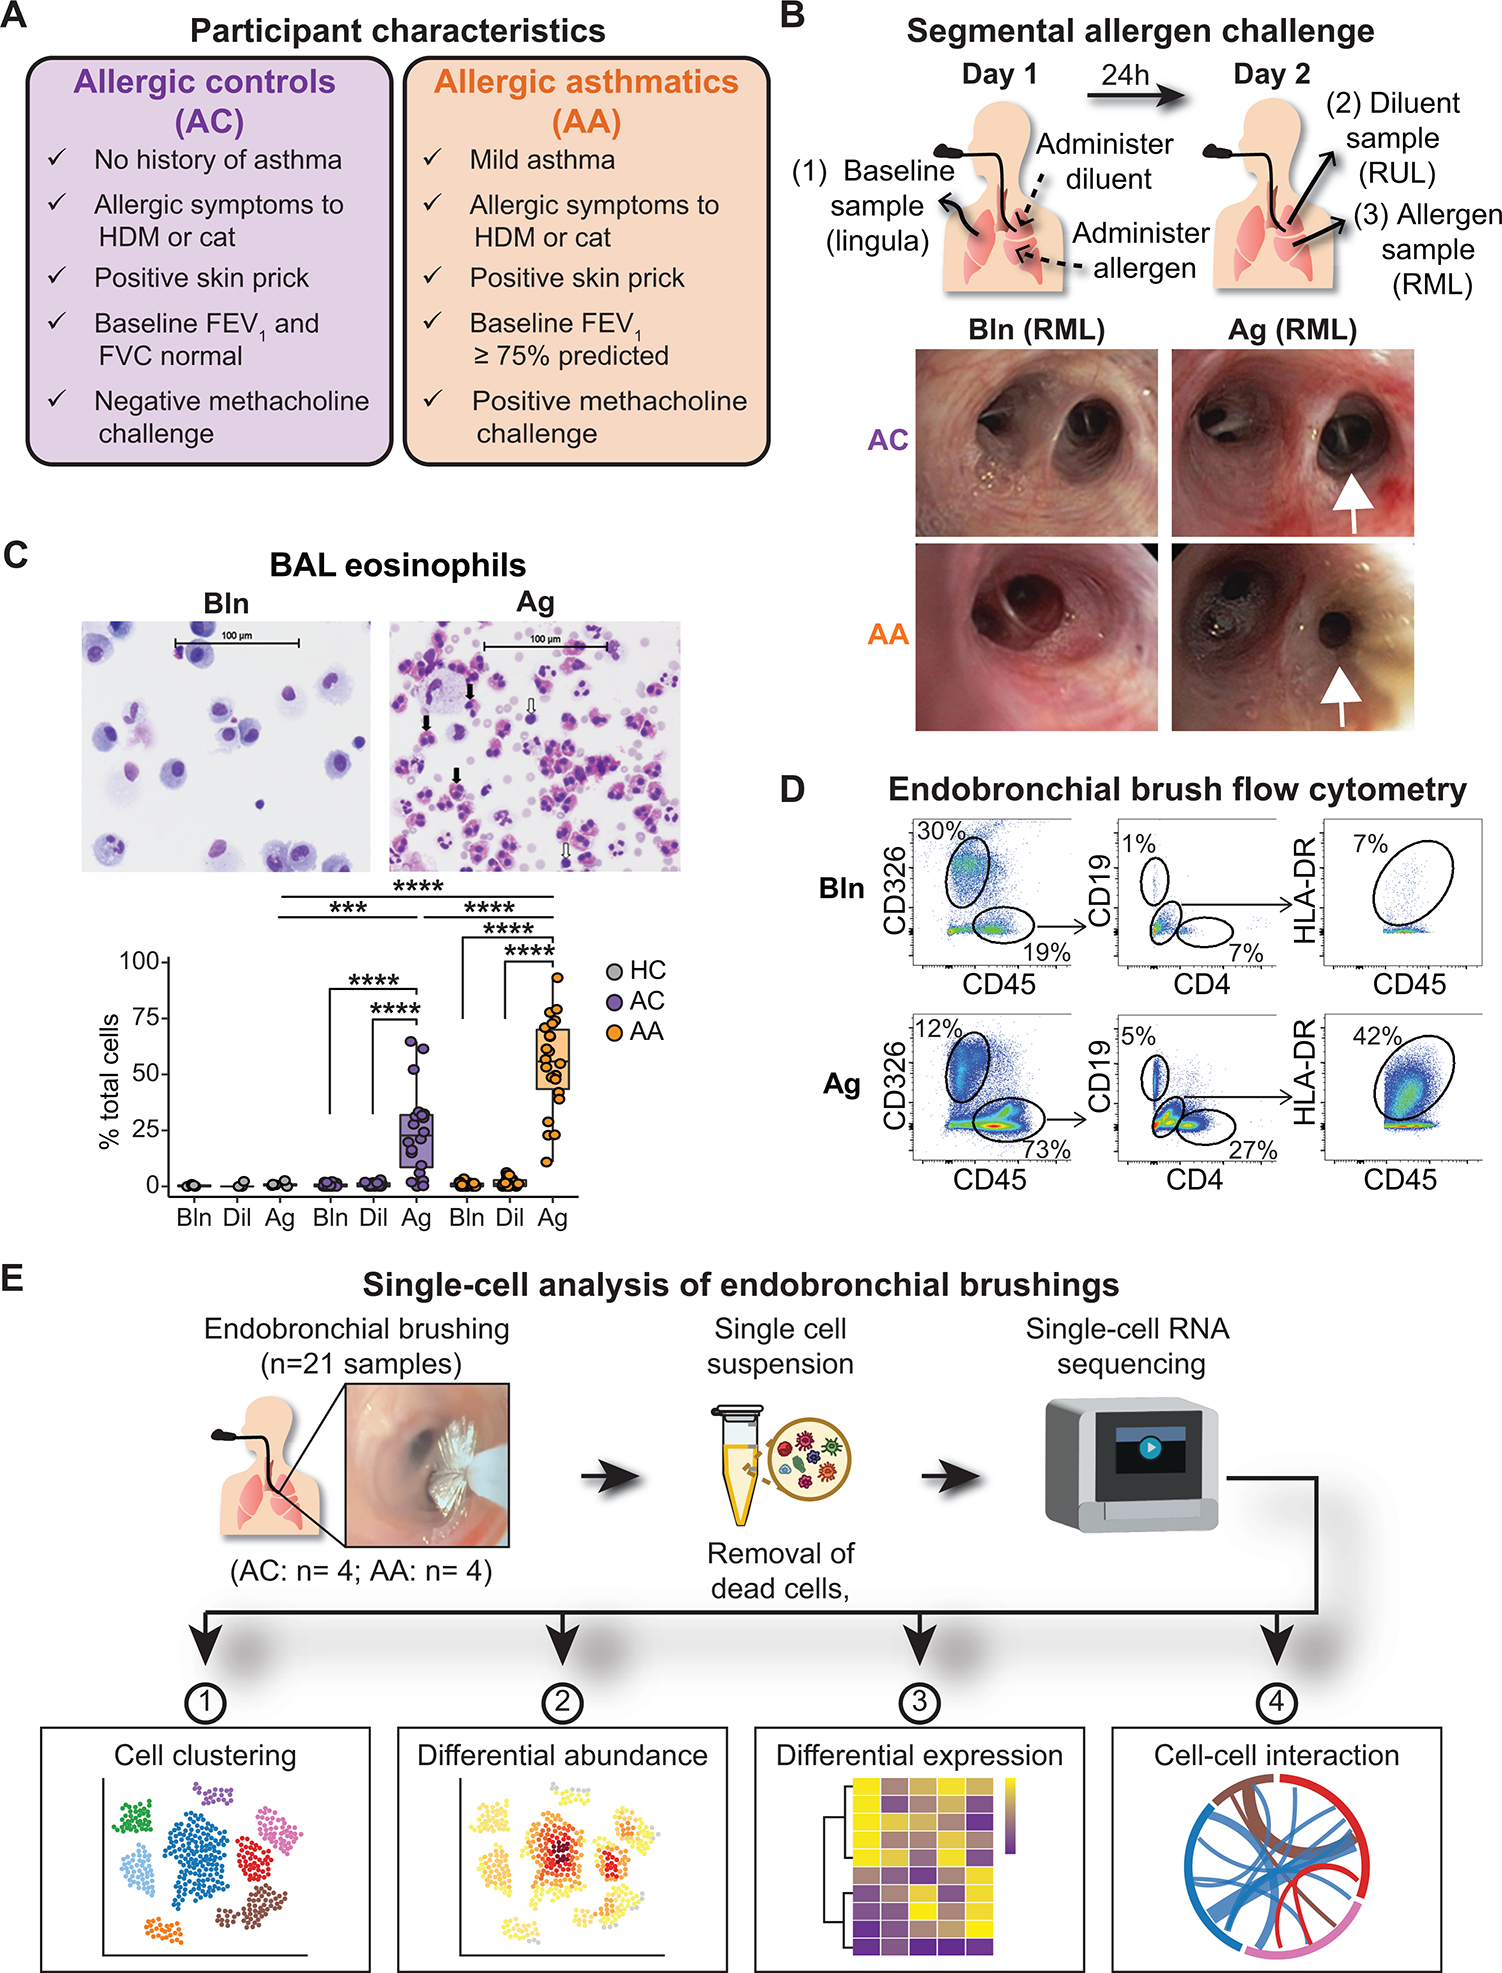
Fig. 1. A human model of allergen-induced asthma exacerbation using SAC.

(A) Characteristics of AC and AA participants. (B) Design of the bronchoscopic SAC procedure. BAL and endobronchial brush samples were obtained at baseline (from the lingula) and 24 hours after administration of diluent to the right upper lobe (RUL) and allergen to the right middle lobe (RML). Representative images of RML airway segments from one AC participant (top row) and one AA participant (bottom row) at baseline (left) and after SAC (right). In the AA participant, the allergen-challenged segmental airway is narrowed, and mucus is present after SAC. (C) Representative images of cytospin preparations from BAL from one AA participant and quantification of BAL eosinophils in nonallergic healthy controls (HCs; n = 5), ACs (n = 20), and AAs (n = 22). Black arrows indicate eosinophils; white arrows indicate lymphocytes. (D) Representative flow cytometry of endobronchial brush samples at baseline (Bln; top row) and after allergen challenge (Ag; bottom row) from one AA participant. Epithelial cells were identified as CD326+CD45−. After gating on CD45+ cells, CD19+ B cells and CD4+ T cells were identified, as were CD19−CD4−HLA-DR+ antigen-presenting cells. (E) scRNA-seq was performed on endobronchial brushing samples (n = 21) collected from segmental airways, and downstream analysis was performed to identify differences between ACs (n = 4) and AAs (n = 4). In (C), boxes represent the median (line) and IQR, with whiskers extending to the remainder of the distribution no more than 1.5× IQR, with dots representing individual samples. P values were generated using a mixed-effects model with Šidák correction to adjust for multiple comparisons. ***P < 0.001 and ****P < 0.0001.
