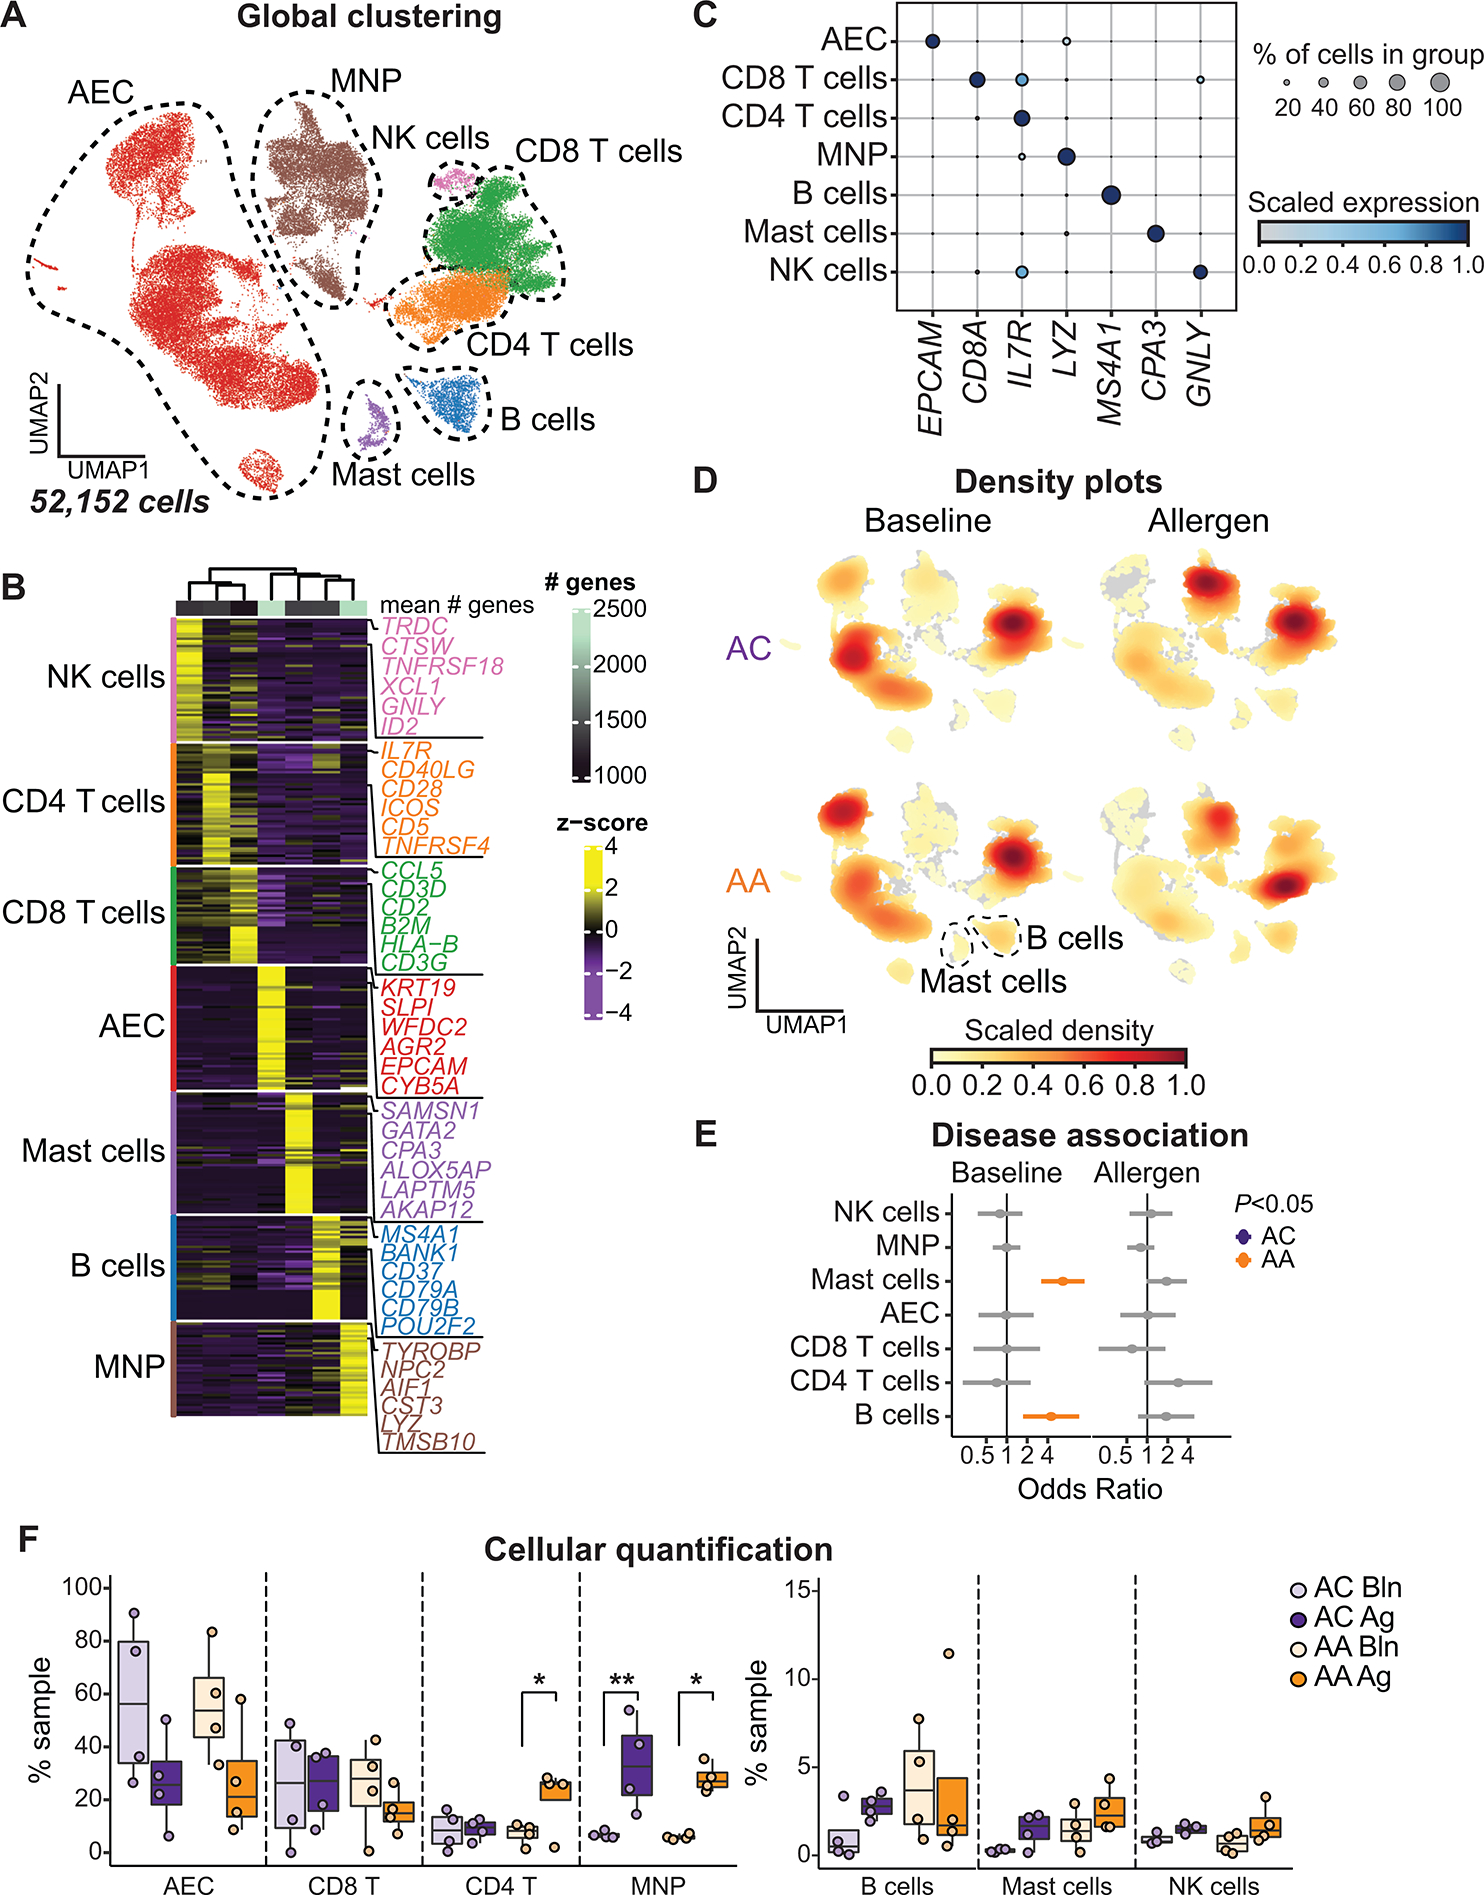
Fig. 2. Allergen-induced immune cell enrichment in the airway mucosa.

(A) UMAP embedding of 52,152 high-quality single cells color-coded by predicted cell lineage. NK, natural killer. (B) Heatmap showing the top discriminative gene sets for each cell lineage compared with every other lineage. Color scales denote the normalized gene expression (mean zero, unit variance) for each cluster and the mean number of genes per cluster (top bar). (C) Dot plot showing the percentage and expression level of marker genes defining each cell lineage, with the size of the dot representing the percentage of cells within each lineage expressing each marker and the color intensity indicating the scaled expression level. (D) UMAP embedding of cell density displaying the proportion of each cell lineage at baseline (left) and after allergen challenge (right) compared with every other cell lineage, faceted by disease group (ACs: top, AAs: bottom). (E) OR of disease association by cell lineage at baseline and after allergen challenge. Color-coding denotes significant associations with ACs (OR < 1, purple) or AAs (OR > 1, gold). (F) Contribution of each cell lineage defined in (B), shown as percentage (%) of total sample at baseline (Bln) and after allergen challenge (Ag). In (E), dots and whiskers represent OR with 95% confidence interval, calculated using a mixed-effects association logistic regression model (P < 0.05 corrected for multiple comparisons using the Tukey method). In (F), boxes represent the median (line) and IQR, with whiskers extending to the remainder of the distribution no more than 1.5× IQR and dots representing individual samples. P values generated using a mixed-effects model with Šidák correction to adjust for multiple comparisons. *P < 0.05 and **P < 0.01.
