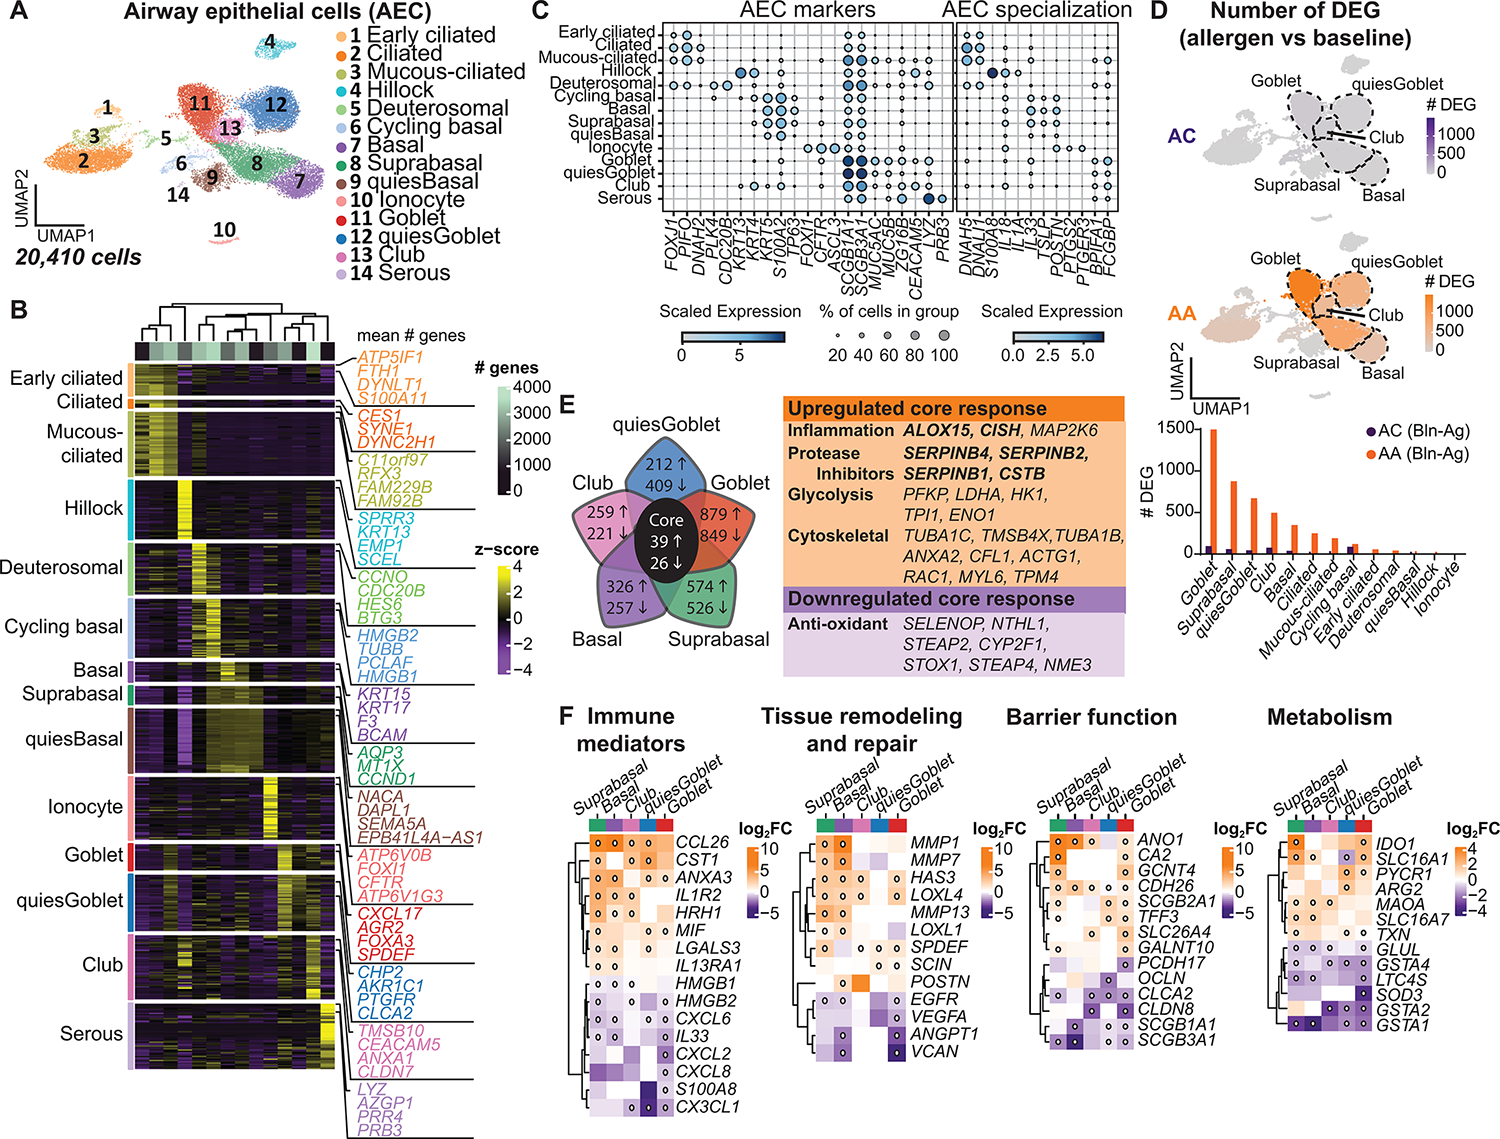
Fig. 3. Dynamic transcriptional response in basal and secretory epithelial cells after allergen challenge.

(A) UMAP embedding derived from subclustering of 20,410 AECs. (B) Heatmap showing the top discriminative gene sets for each cluster compared with every other AEC cluster. Color scales denote the normalized gene expression (mean zero, unit variance) for each cluster and the mean number of genes per cluster (top bar). (C) Dot plot depicting gene expression levels and percentage of cells expressing genes across AECs. (D) UMAP plots with color intensity (top) indicating the number of DEGs induced by SAC in ACs and AAs compared with baseline. The number of DEGs induced by SAC, quantified by cluster for AAs and ACs (bottom). (E) Venn diagram depicting the top five AEC clusters with the most DEGs after SAC, with the number of genes up-regulated (up arrow) or down-regulated (down arrow) in AAs compared with ACs using an interaction term for disease state and experimental condition. The core transcriptional response is denoted in the table (right). Bolded genes are induced by IL-13. (F) Heatmap of selected DEGs. Color scale indicates FC differences between AAs and ACs after SAC. White dot indicates FDR < 0.1. (D) DEG based on FDR < 0.1 and log2FC > 0.5 using the Wald test on pseudo-bulk count matrix. (E and F) DEGs based on FDR < 0.1 and log2FC > 0.5 using a likelihood ratio test on pseudo-bulk count matrix.
