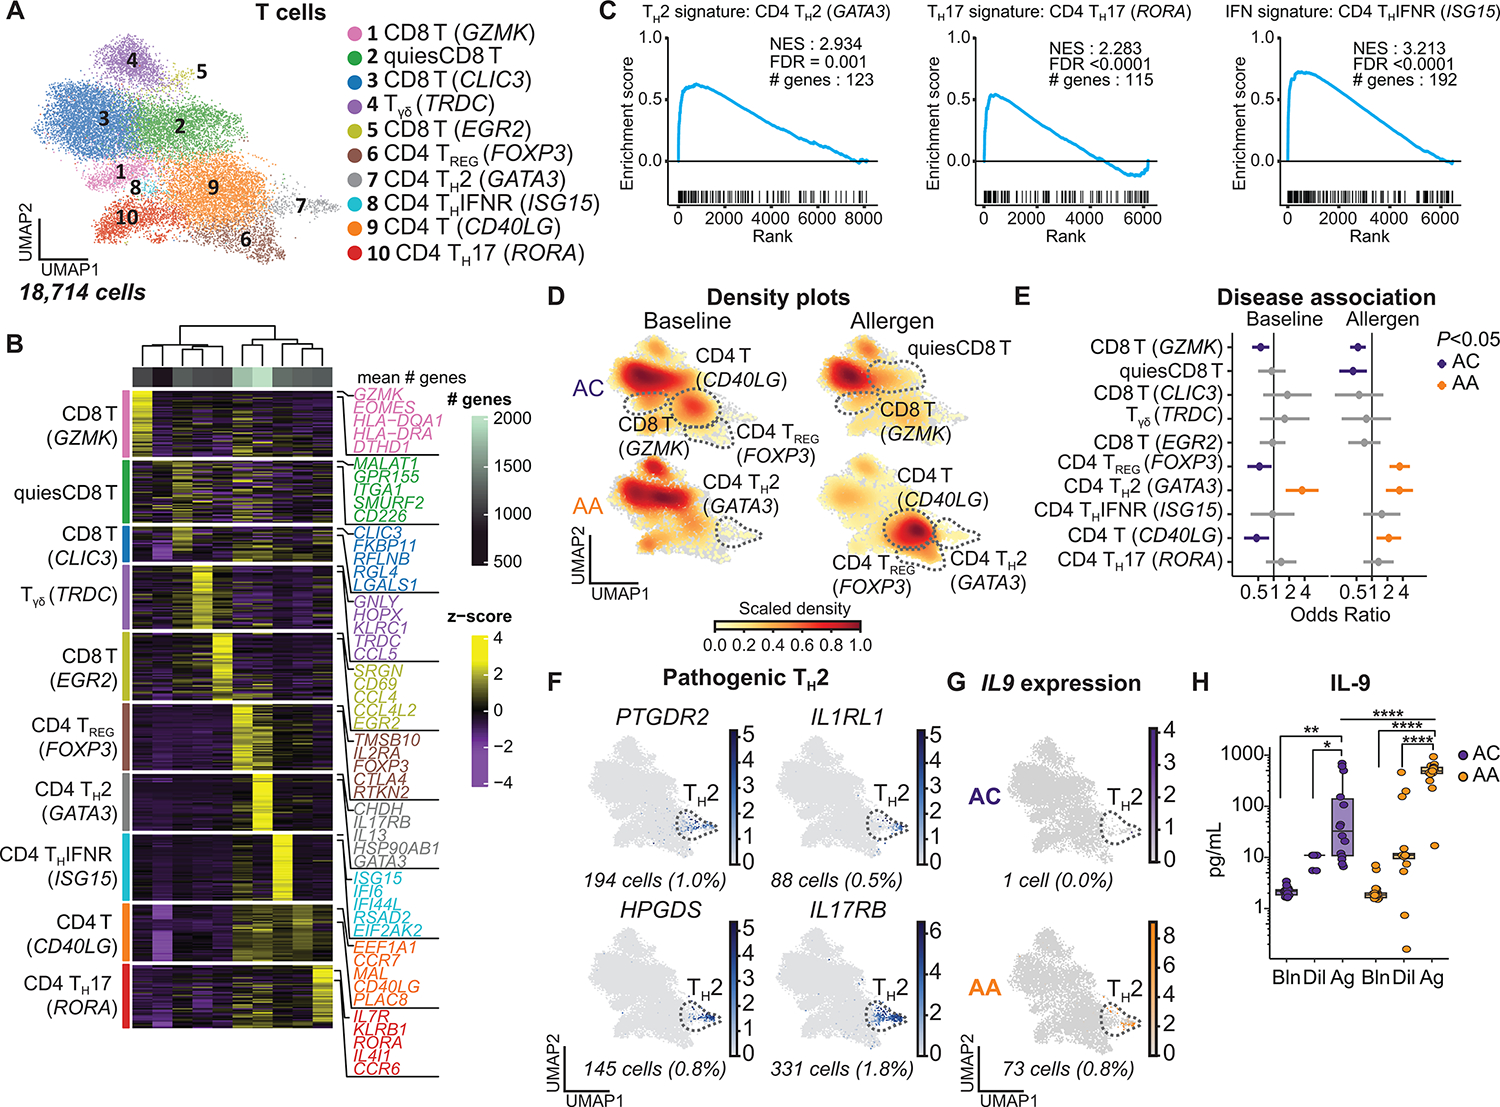
Fig. 4. IL9-expressing pathogenic TH2 cells specific to asthmatic airways.

(A) UMAP embedding derived from subclustering of 18,714 T cells. (B) Heatmap showing the top discriminative gene sets for each cluster, compared with every other T cell cluster and the mean number of genes per cluster (top bar). (C) GSEA of CD4 TH2, TH17, and THIFNR clusters comparing the marker genes for these clusters with published T cell gene sets from Seumois et al. (33) (data file S7). (D) UMAP embedding of cell density displaying the proportion of each T cell subset at baseline (left) and after allergen challenge (right) compared with every other T cell subset, faceted by disease group (ACs: top, AAs: bottom). (E) OR of disease association by cluster at baseline and after allergen challenge. (F) Feature plots of pathogenic TH2 genes using pseudo-coloring to indicate gene expression. (G) Feature plot of IL9 expression using pseudo-coloring to indicate gene expression, faceted by group. (H) BAL concentration of IL-9 (ACs, n =14; AAs, n = 18). In (E), dots and whiskers represent OR with 95% confidence interval, calculated using a mixed-effects association logistic regression model (P < 0.05 corrected for multiple comparisons using the Tukey method). In (F) and (G), cell number and percentages (%) represent gene expression across all T cell subsets. Scaled gene expression in log(CPM). In (H), boxes represent the median (line) and IQR, with whiskers extending to the remainder of the distribution no more than 1.5× IQR. P values were generated using a mixed-effects model with Šidák correction to adjust for multiple comparisons. *P < 0.05, **P < 0.01, and ****P < 0.0001.
