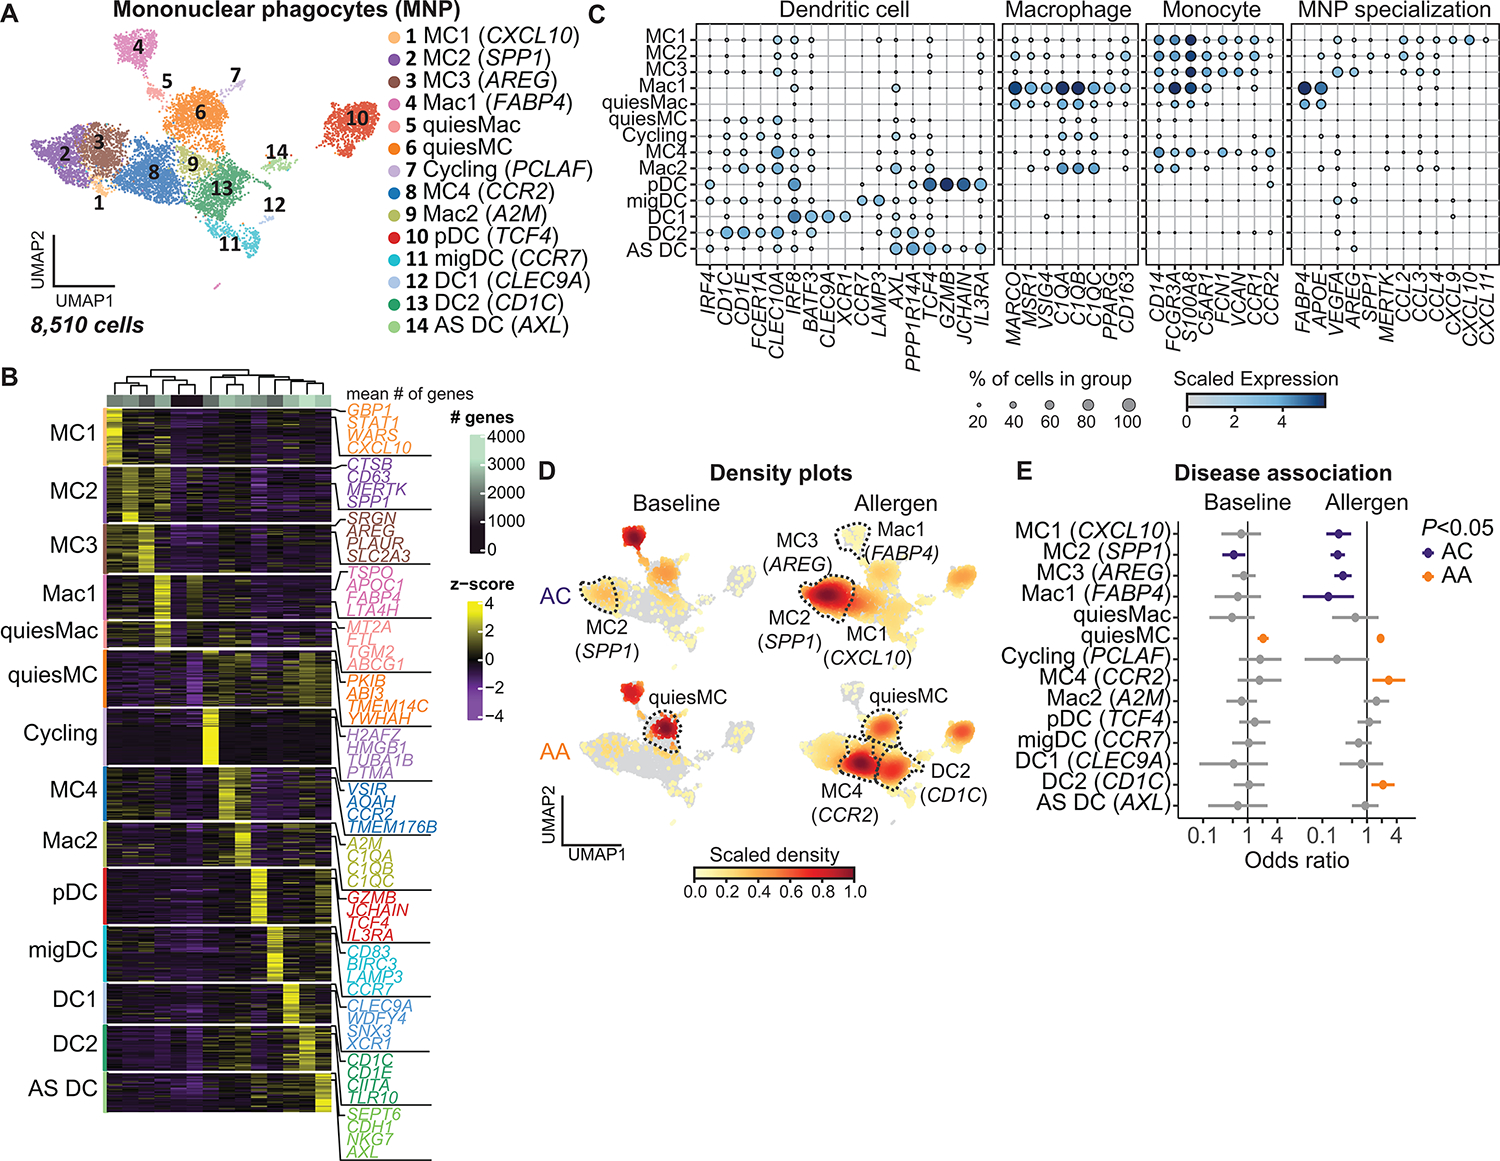
Fig. 5. Distinct MNP profiles in asthmatics and ACs.

(A) UMAP embedding derived from subclustering of 8510 MNPs. (B) Heatmap showing the top discriminative gene sets for each cluster compared with every other MNP cluster and the mean number of genes per cluster (top bar). (C) Dot plot depicting gene expression levels and percentage of cells expressing genes across MNP clusters. (D) UMAP embedding of cell density displaying the proportion of each MNP subset at baseline (left) and after allergen challenge (right) compared with every other MNP subset, faceted by disease group (ACs: top, AAs: bottom). (E) OR of disease association by cluster at baseline and after allergen challenge. In (E), dots and whiskers represent OR with 95% confidence interval, calculated using a mixed-effects association logistic regression model (P < 0.05 corrected for multiple comparisons using the Tukey method).
