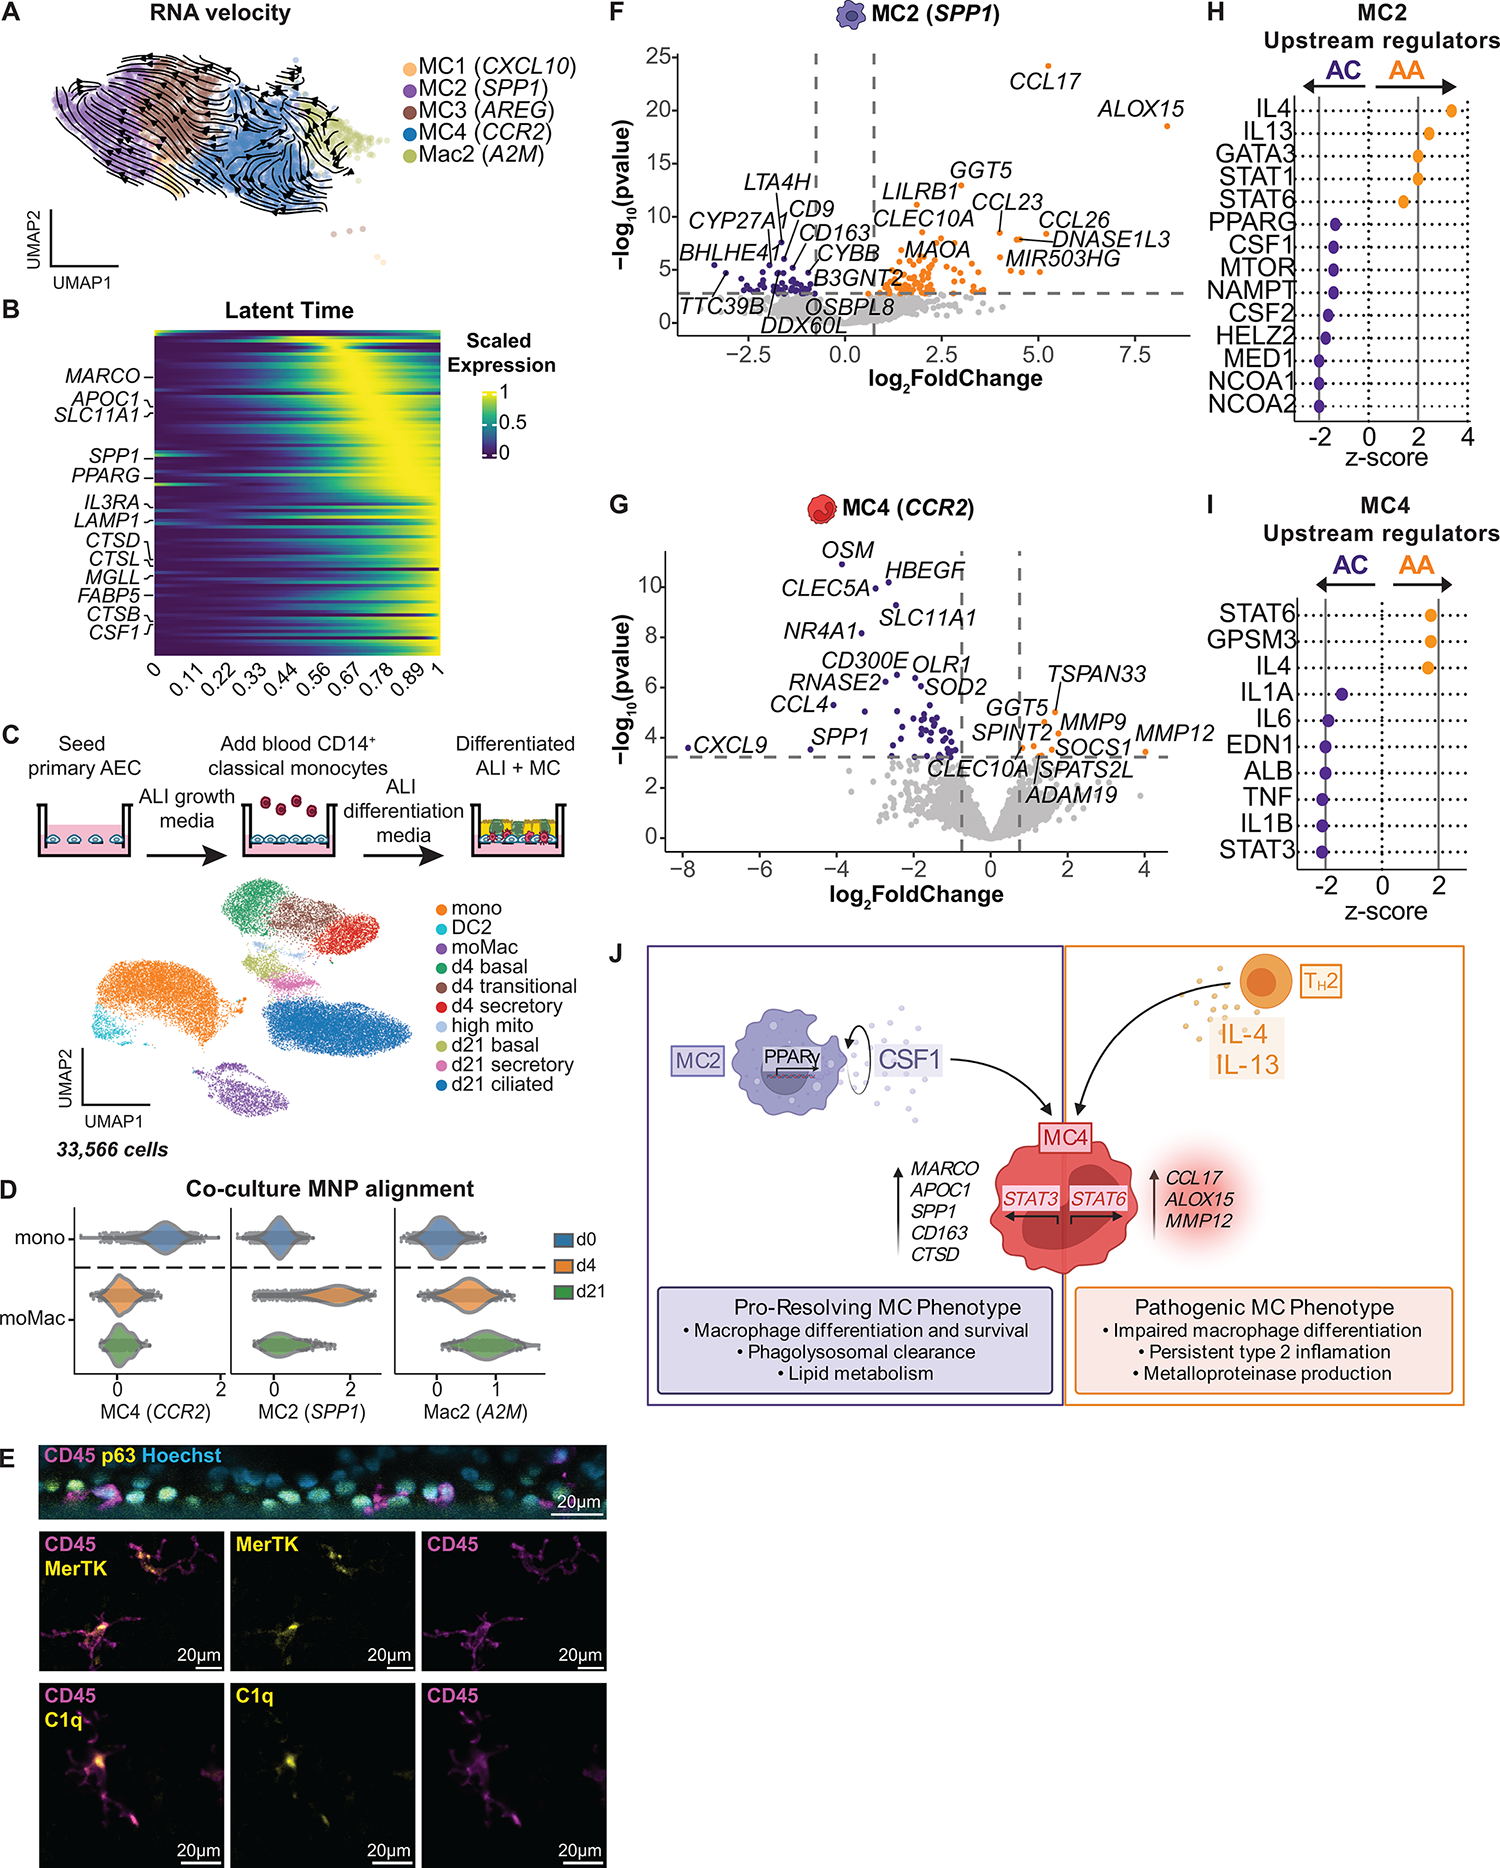
Fig. 6. A pathogenic transcriptional program in airway MCs in asthmatics after SAC.

(A) RNAvelocities of a subset of MNP clusters visualized as streamlines projected on UMAP embedding. (B) Heatmap of gene expression pattern for the top 100 lineage driver genes correlated along the inferred differentiation trajectory. (C) Coculture model for blood CD14+ monocytes and AECs at ALI. UMAP embedding derived from clustering of 33,566 cells consisting of baseline blood CD14+ monocytes and cocultured cells collected at day 4 (d4) and day 21 (d21). Mono, monocyte; moMac, monocyte-derived Mac; mito, mitochondrial. (D) Alignment of blood CD14+ monocytes (day 0; d0) and moMacs from d4 and d21 coculture, using gene set scores (x axis) of airway MNP subclusters (Fig. 5A). (E) Immunofluorescence staining with orthogonal reconstruction at d21 of coculture demonstrates CD45+ immune cells (magenta) integrated into the p63+ basal cell layer (yellow) with Hoechst nuclear counterstain (cyan). CD45+ immune cells (magenta) exhibit prominent cytoplasmic projections and expression of MERTK and C1q (yellow). (F and G) Volcano plots representing DEGs in MC2 (F) and MC4 (G), comparing ACs (purple) with AAs (gold) after SAC. Vertical dotted lines represent cutoff of |log2FC| = 0.5, and horizontal dotted lines represent FDR cutoff = 0.1. (H and I) Predicted upstream regulators of MC2 (H) and MC4 (I) based on DEGs identified in (F) and (G) (ACs: purple, AAs: gold). Vertical solid lines represent z-score cutoff of |2|. (J) Summary figure of MC maturation sequence. (F and G) DEGs based on FDR < 0.1 and log2FC > 0.5 using the Wald test on pseudo-bulk count matrix.
