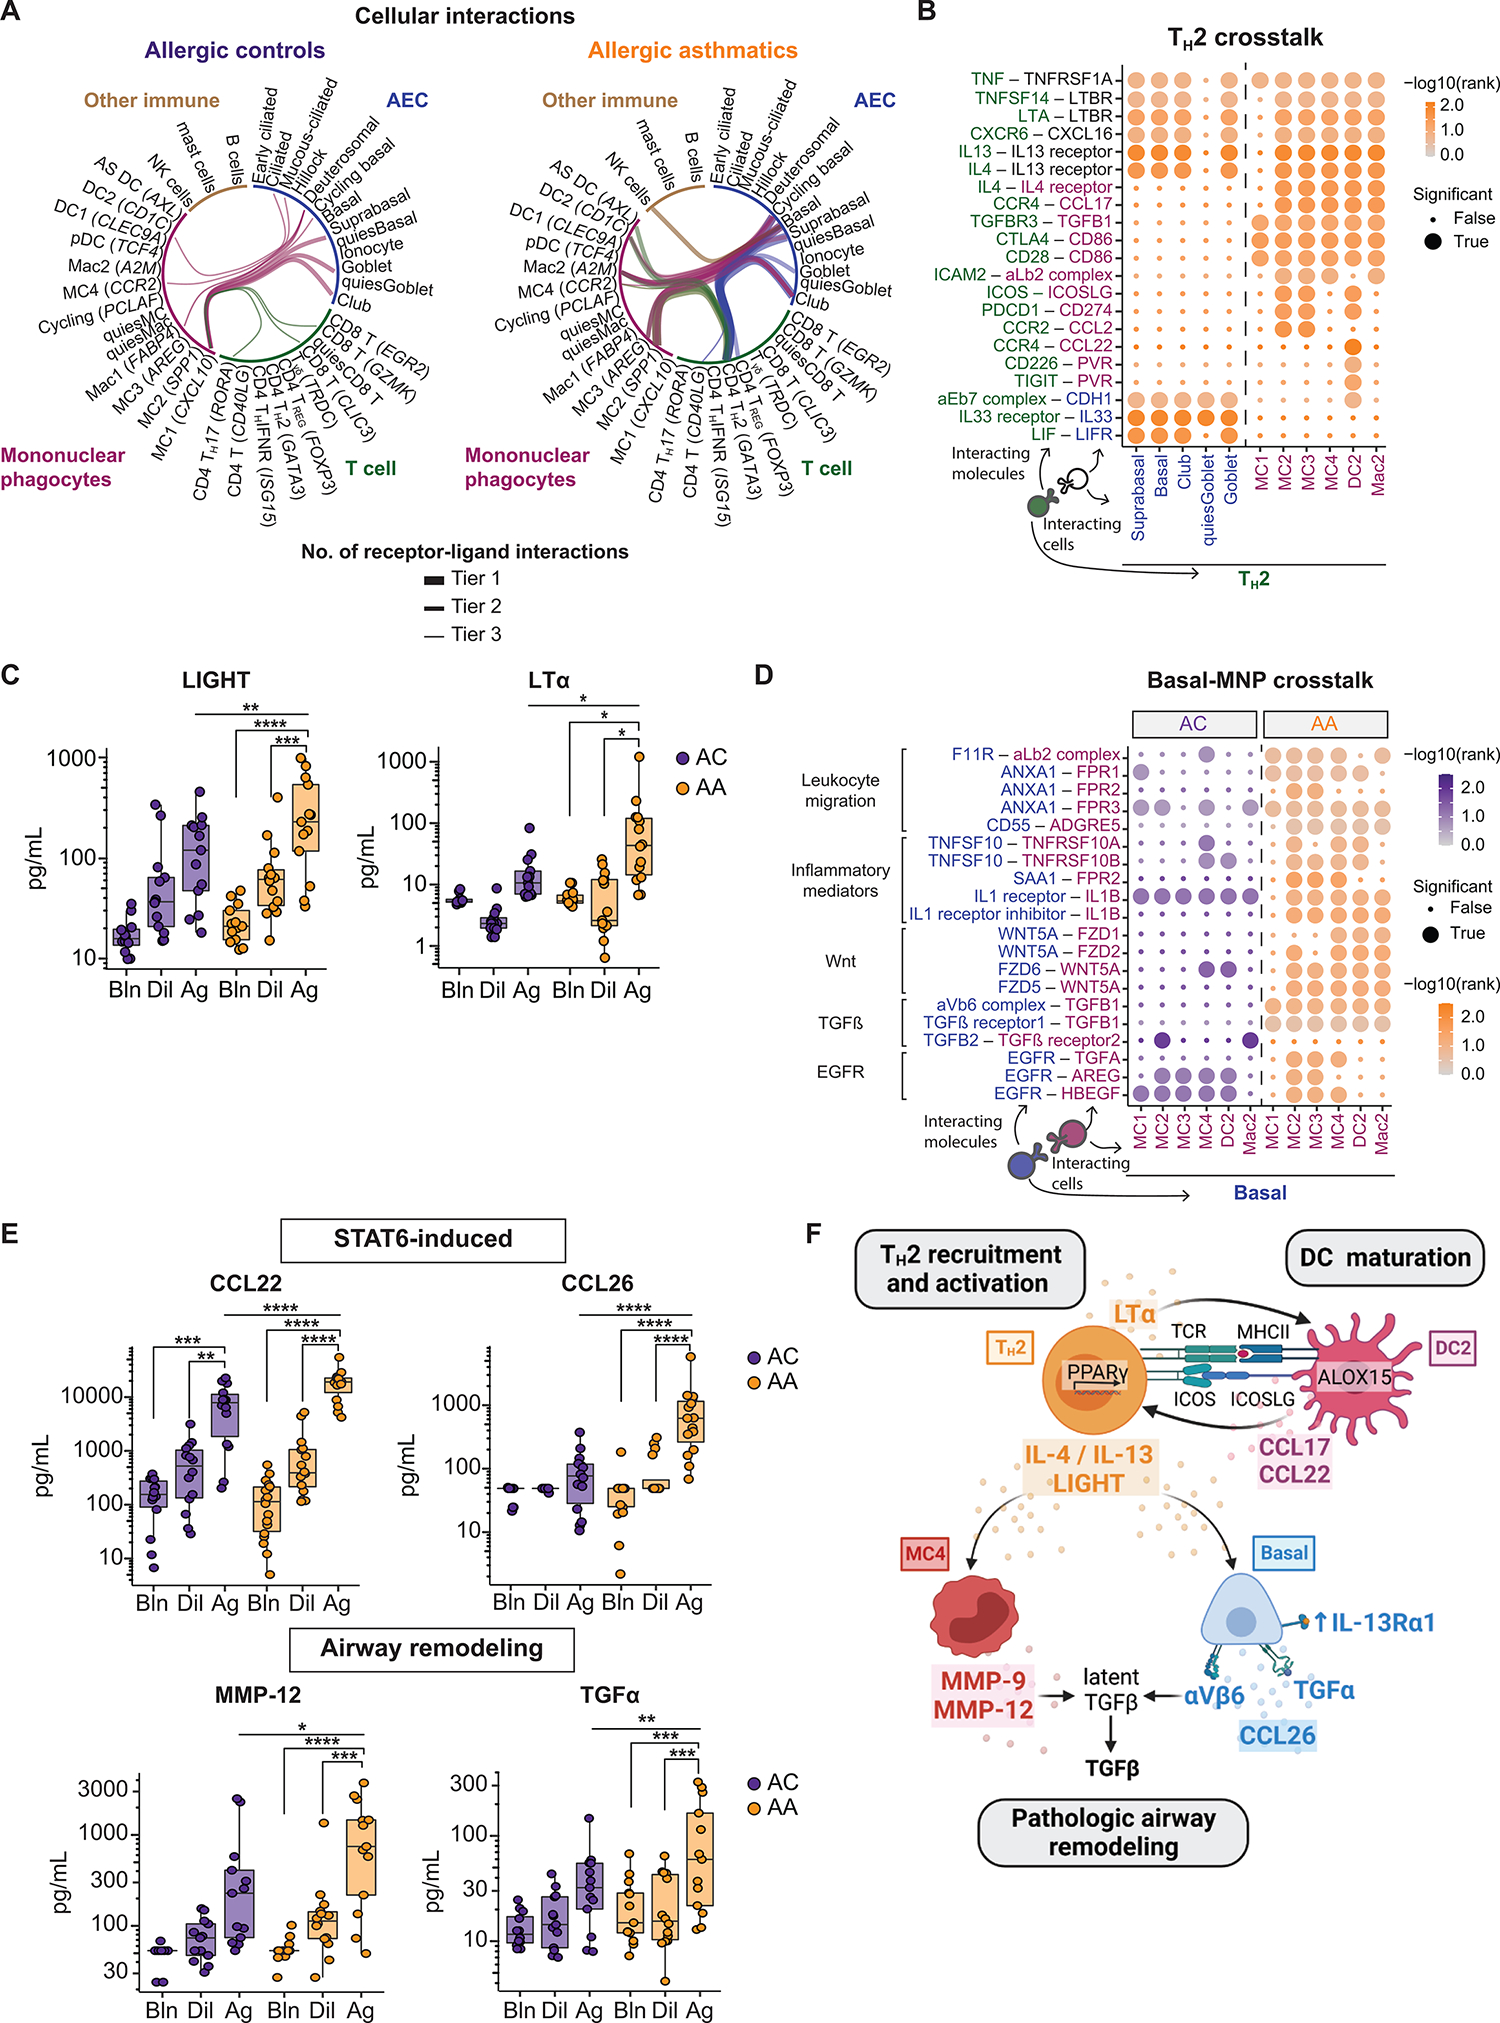
Fig. 7. A pathogenic cellular interactome in asthmatic airways after allergen challenge.

(A) Top 25 cell-cell pairs with the most unique receptor-ligand interactions in ACs and AAs, restricted to interactions between distinct cell lineages. Tiers represent the number of interactions (tier 1: ≥50, tier 2: 40 to 49, tier 3: 30 to 39). (B) Dot plots showing predicted interactions between TH2-AECs and TH2-MNPs after SAC in AAs. (C) BAL concentration of LIGHT (TNFSF14; ACs: n = 13, AAs: n = 14) and LTα (ACs: n = 13, AAs: n = 16). (D) Dot plots showing predicted interactions between AEC-MNP after SAC in AAs and ACs. (E) BAL concentration of CCL22, CCL26, MMP-12, and TGFα (ACs: n = 13, AAs: n = 14). (F) Summary figure of a pathogenic TH2–MNP–basal cell interactome in allergic asthma. In (B) and (D), dot size indicates significance (true: empirical P < 0.001), and color intensity indicates specificity of interaction to disease group [−log10(rank)]. In (C) and (F), boxes represent the median (line) and IQR, with whiskers extending to the remainder of the distribution no more than 1.5× IQR. In (C) and (F), P values were generated using a mixed-effects model with Šidák correction to adjust for multiple comparisons. *P < 0.05, **P < 0.01, ***P < 0.001, and ****P < 0.0001.
