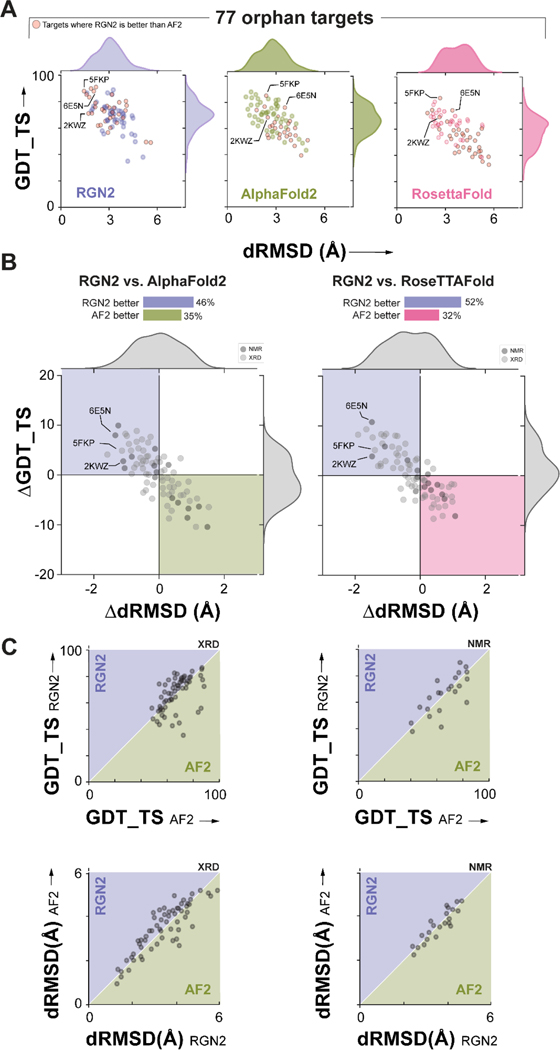
Figure 2. Prediction performance on orphan proteins.
(A) Absolute performance metrics for RGN2 (purple), AF2 (green), and RF (pink) across 77 orphan proteins lacking known homologs. (B) Differences in prediction accuracy between RGN2 and AF2 / RF are shown for the 77 orphan proteins, using dRMSD and GDT_TS as metrics. Points in top-left quadrant correspond to targets with negative ΔdRMSD and positive ΔGDT_TS, i.e., where RGN2 outperforms the competing method on both metrics, and vice-versa for the bottom-right quadrant. The other two quadrant (white) indicate targets where there is no clear winner as the two metrics disagree. The structures of 20% of the targets were determined experimentally using NMR and are denoted with dark gray markers while the remaining 80% of targets were determined using X-ray crystallography (XRD). (C) Head-to-head comparisons of absolute GDT_TS and dRMSD scores for RGN2 and AF2 are shown broken down by experimental method (NMR and XRD). RGN2 outperforms AF2 for proteins in the upper purple triangle while AF2 outperforms RGN2 for targets in the lower green triangle.

