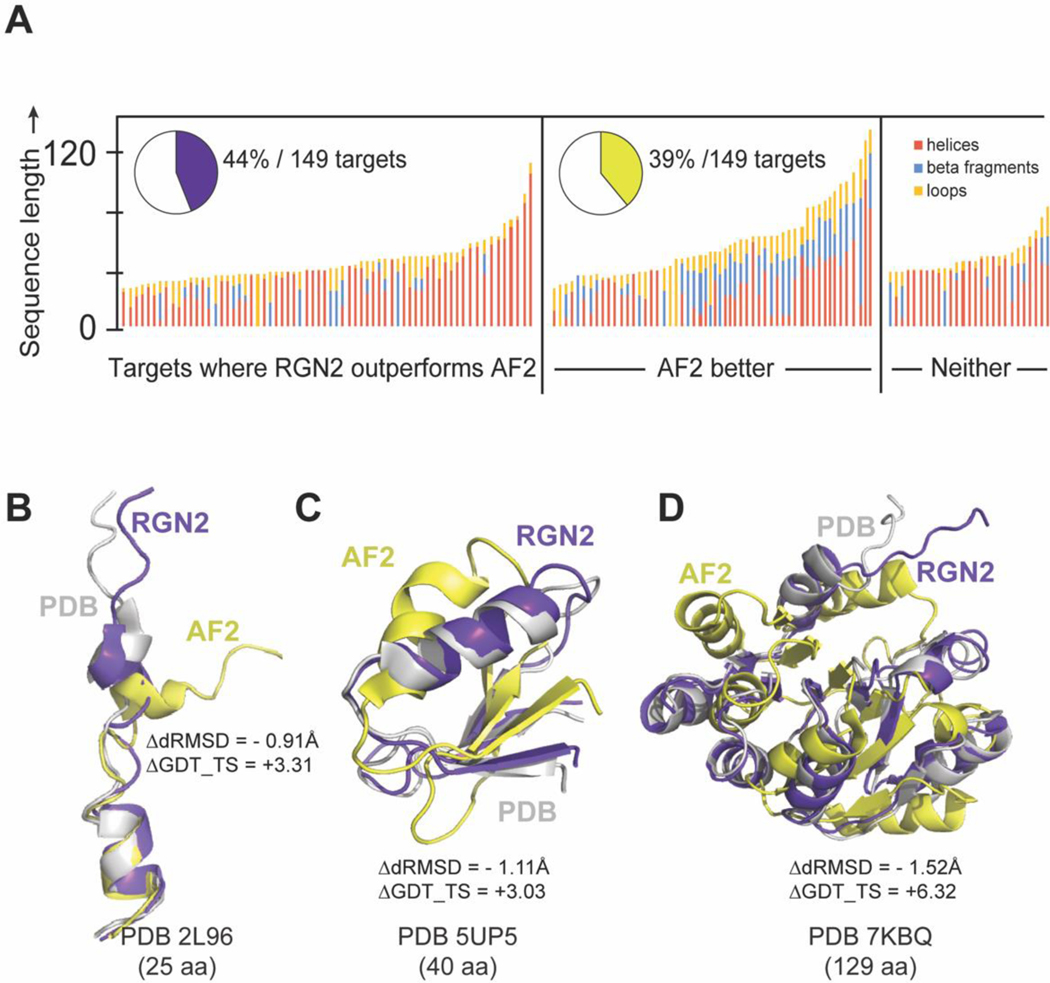
Figure 5. Comparing RGN2 and AF2 structure predictions for designed proteins.
(A) Stacked bar chart shows 149 de novo designed proteins. Bar height indicates protein length. (B) Overlaid ribbon diagrams of PDB entries (with increasing protein length) 2L96, 5UP5, and 7KBQ (white) and RGN2 (purple) and AF2 (yellow) predicted structures are visually depicted to show how RGN2 outperforms AF2 for each of these cases.

