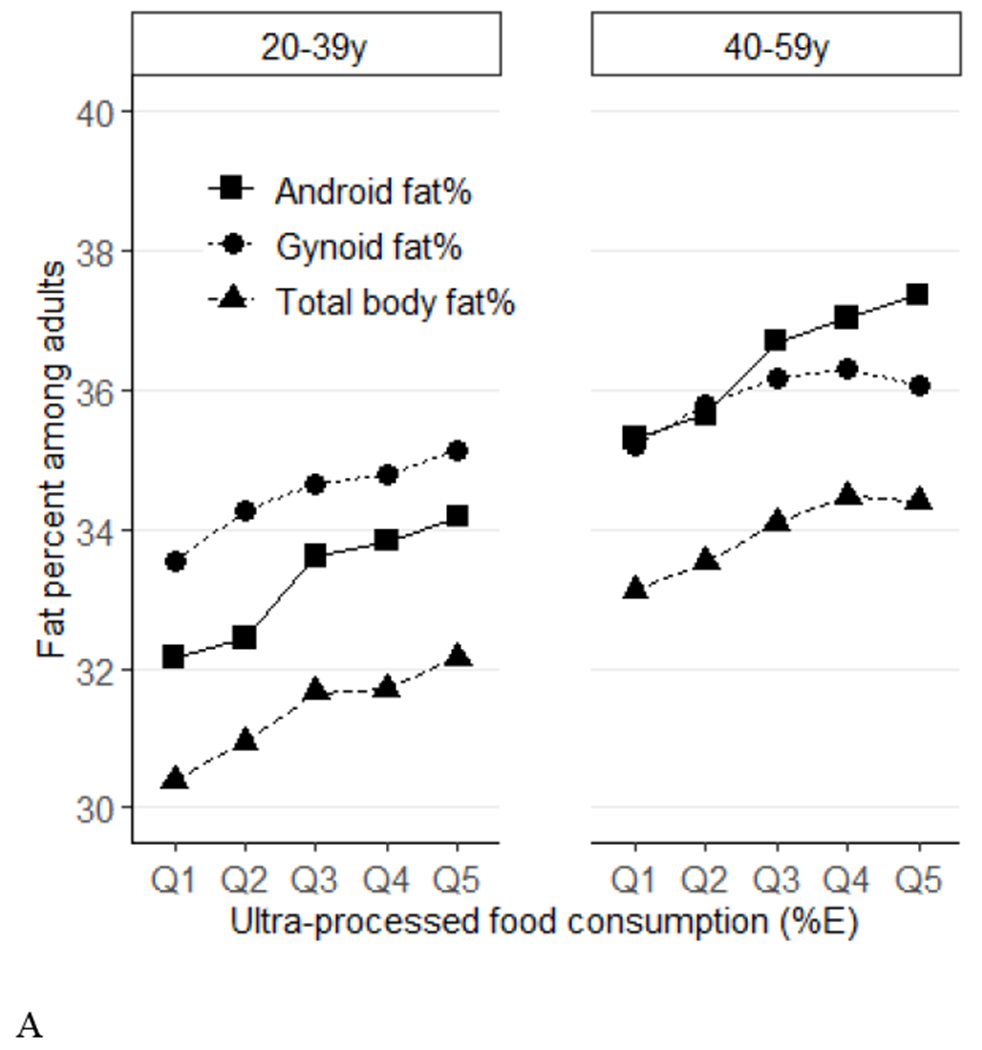
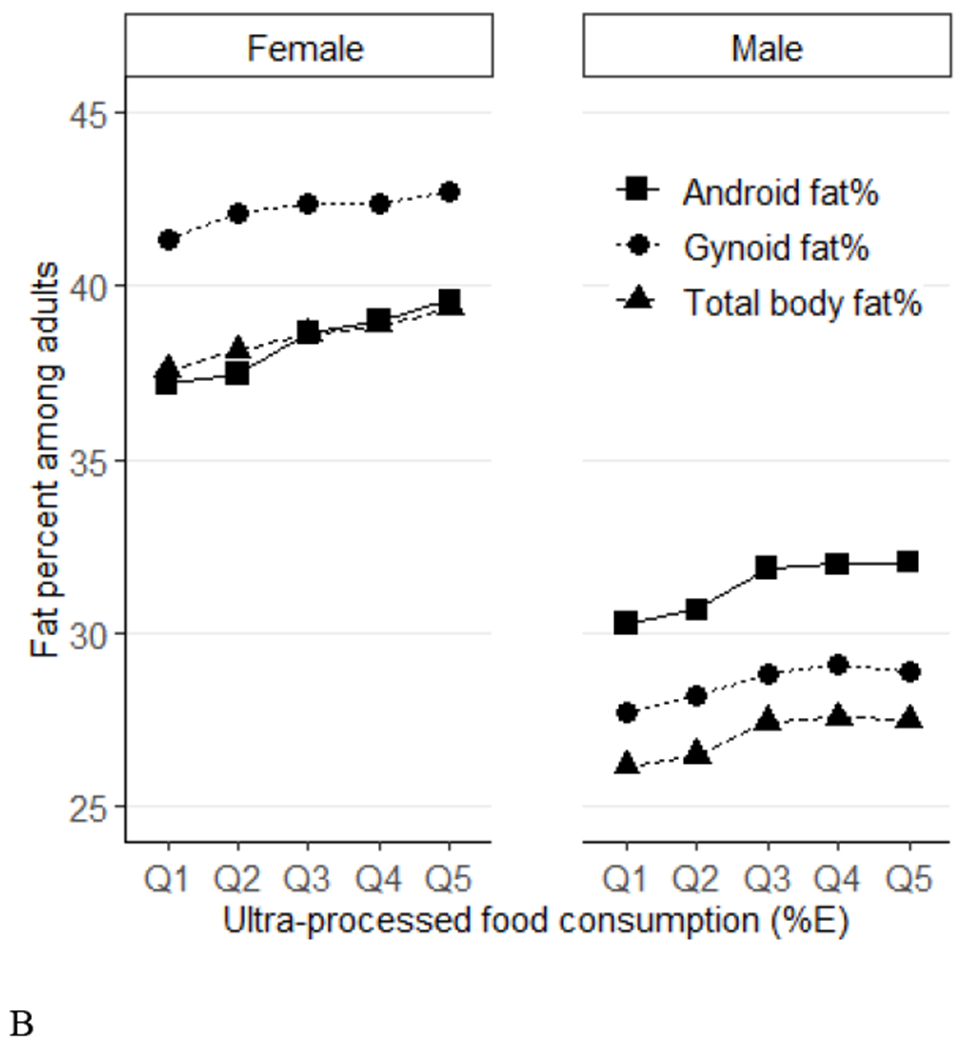
Figure 1.


Predicted means of percent fat (total, android, gynoid) across quintiles of ultraprocessed food consumption (%E) among US adults (aged 20-59 years) by age groups (Panel A) and sex (Panel B), NHANES 2011–2018. Data were adjusted for NHANES survey weights to be nationally representative. %E, % energy; NHANES, National Health and Nutrition Examination Survey. By age, P-trend<0.001 for all. P-interactions are 0.88 for total %fat, 0.42 for android %fat, and 0.86 for gynoid. By sex, P-trend <0.001 for all. P-interactions are 0.19 for total %fat, 0.03 for android %fat, and 0.67 for gynoid.
