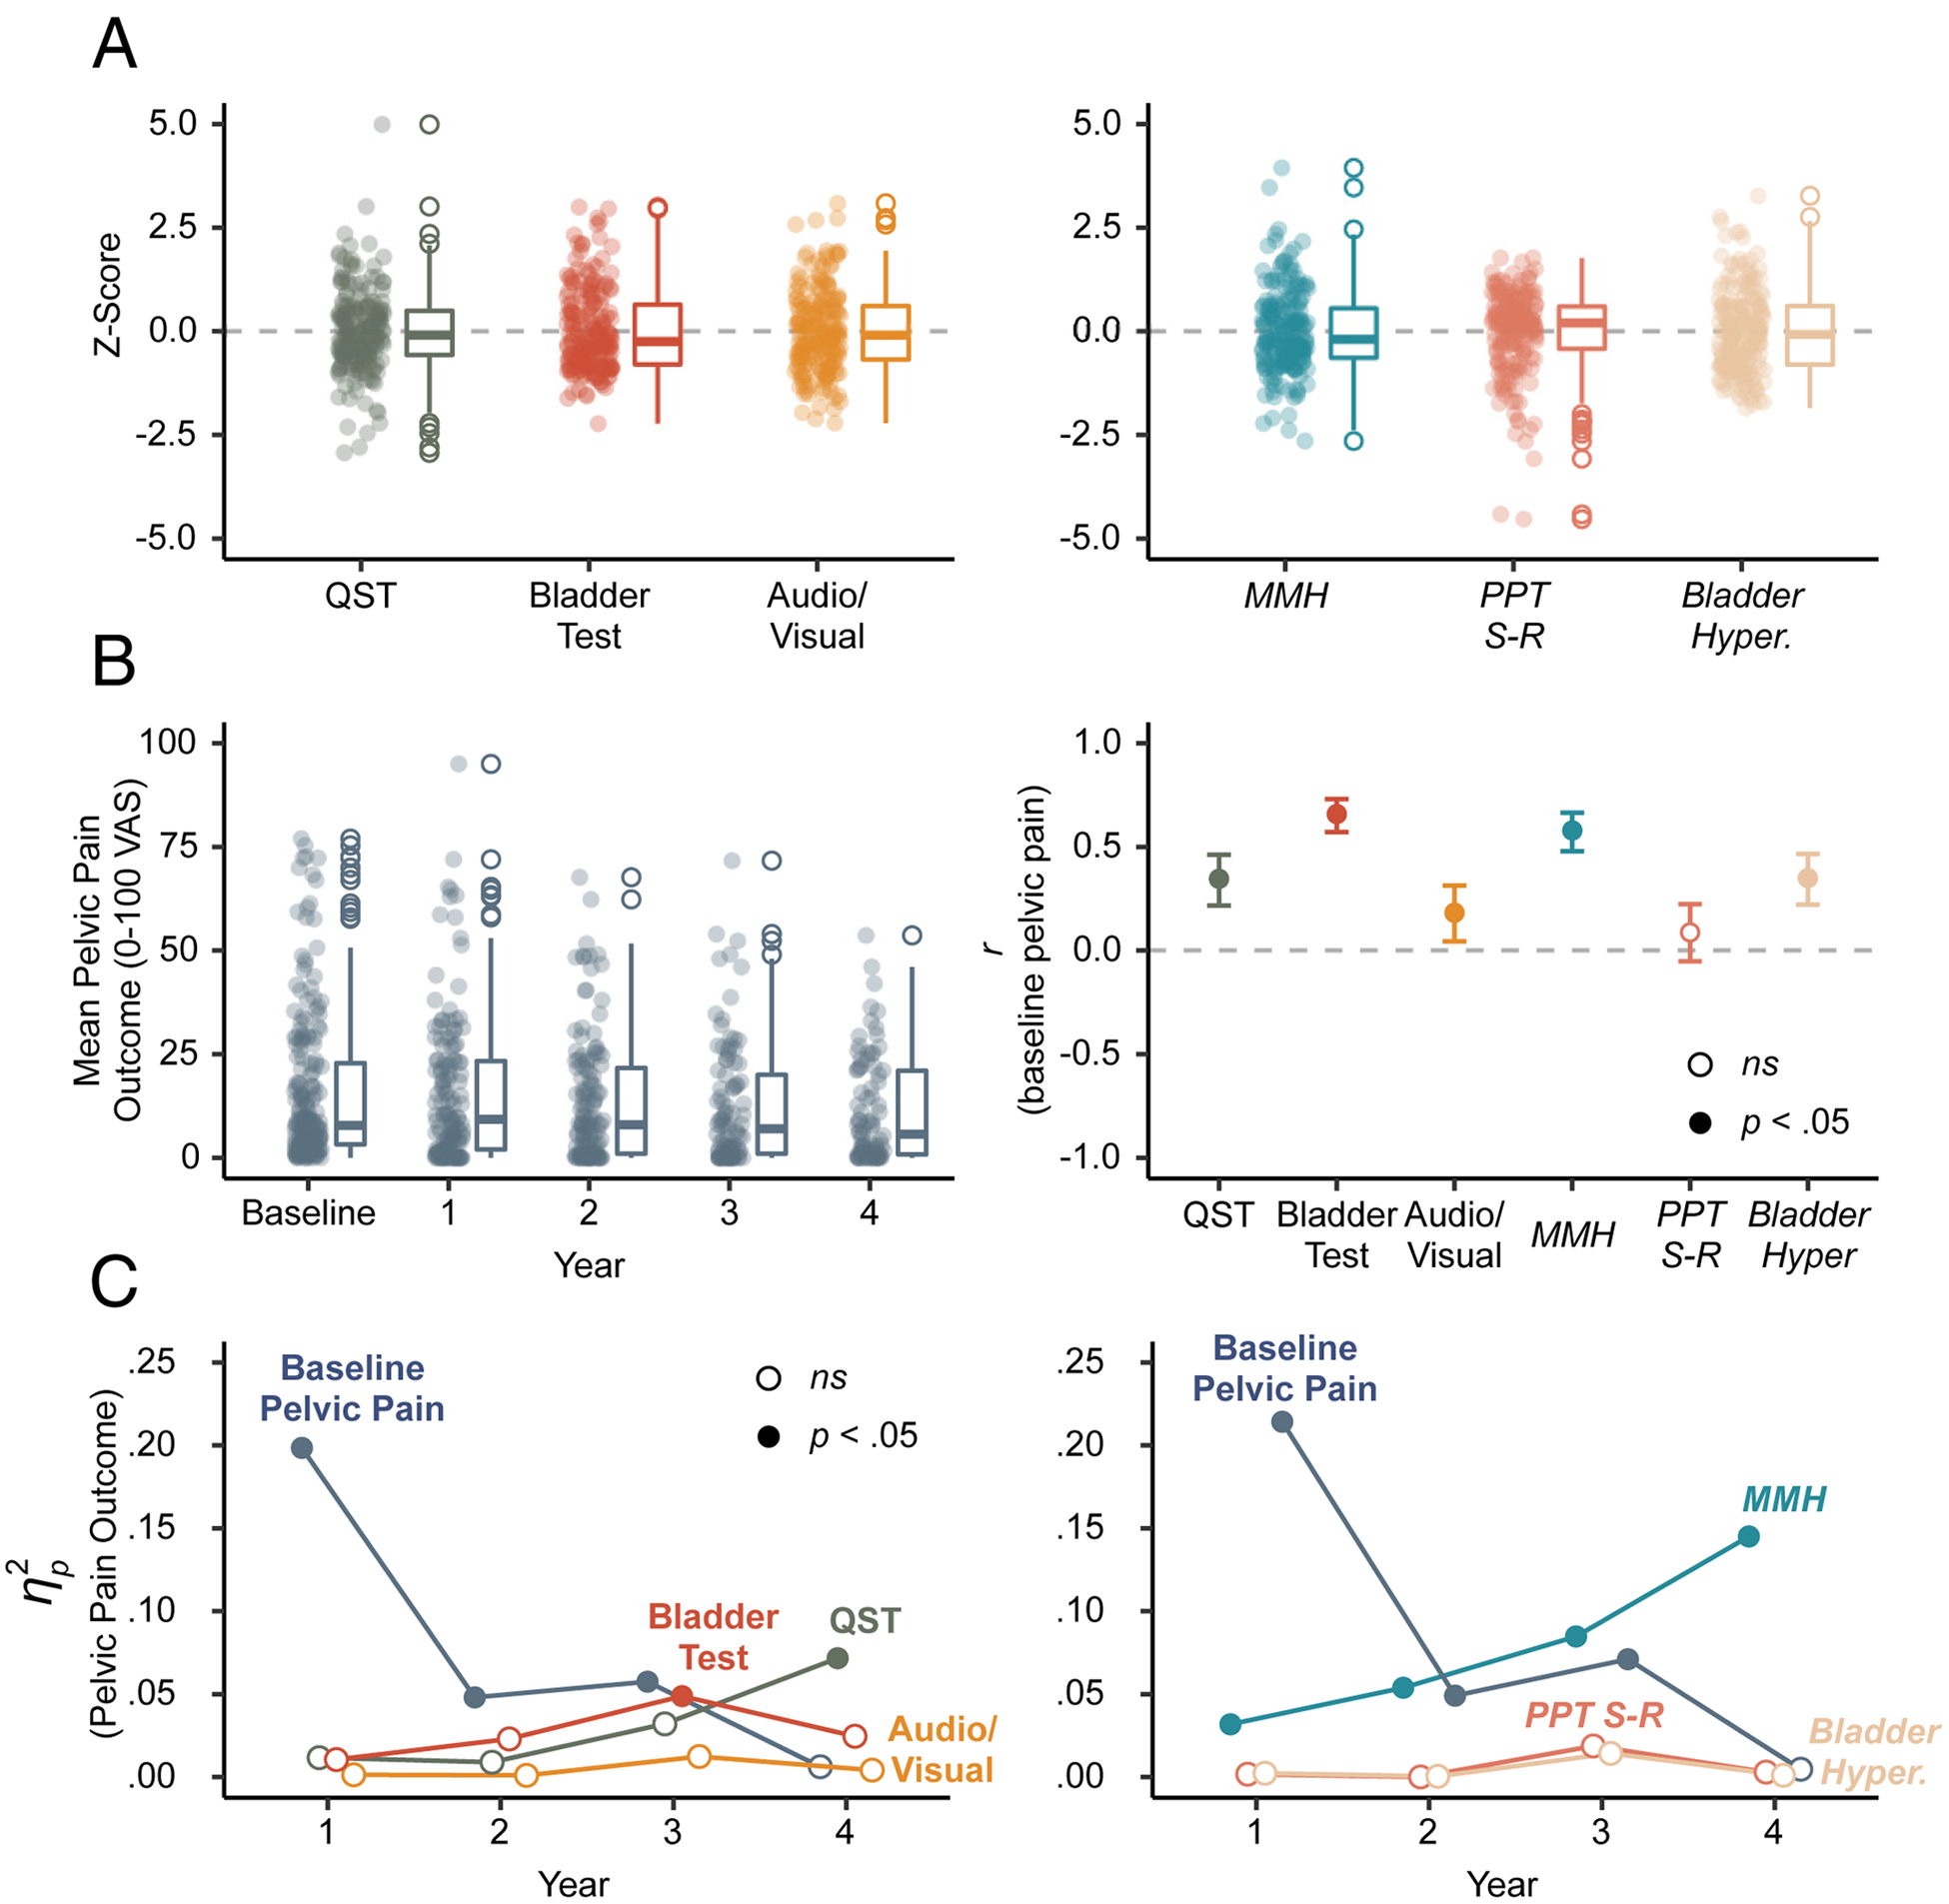
Figure 2. MMH provides better prediction of future pelvic pain.

A) Box plots of Z-scores for each sensory testing composite variable (left) and principal component (PC) used for regression modeling (right). B) Box plots of pelvic pain outcome across the baseline visit and annual questionnaires (left); Correlations between baseline pelvic pain and predictors (i.e., sensory testing composites and PCs). Error bars are 95% confidence intervals and all correlations were significant (filled circles) except PPT S-R (right). C) Explained variance () of pelvic pain outcome for each sensory testing composite (left) and PC (right) accounting for baseline pelvic pain. Significant predictors (filled circles) include baseline pelvic pain, bladder test, QST, and MMH. Italicized text labels refer to PCs. QST=quantitative sensory testing; MMH=multimodal hypersensitivity; PPT-SR=pressure pain threshold stimulus-response (function); Hyper.=hypersensitivity; VAS=visual analog scale.
