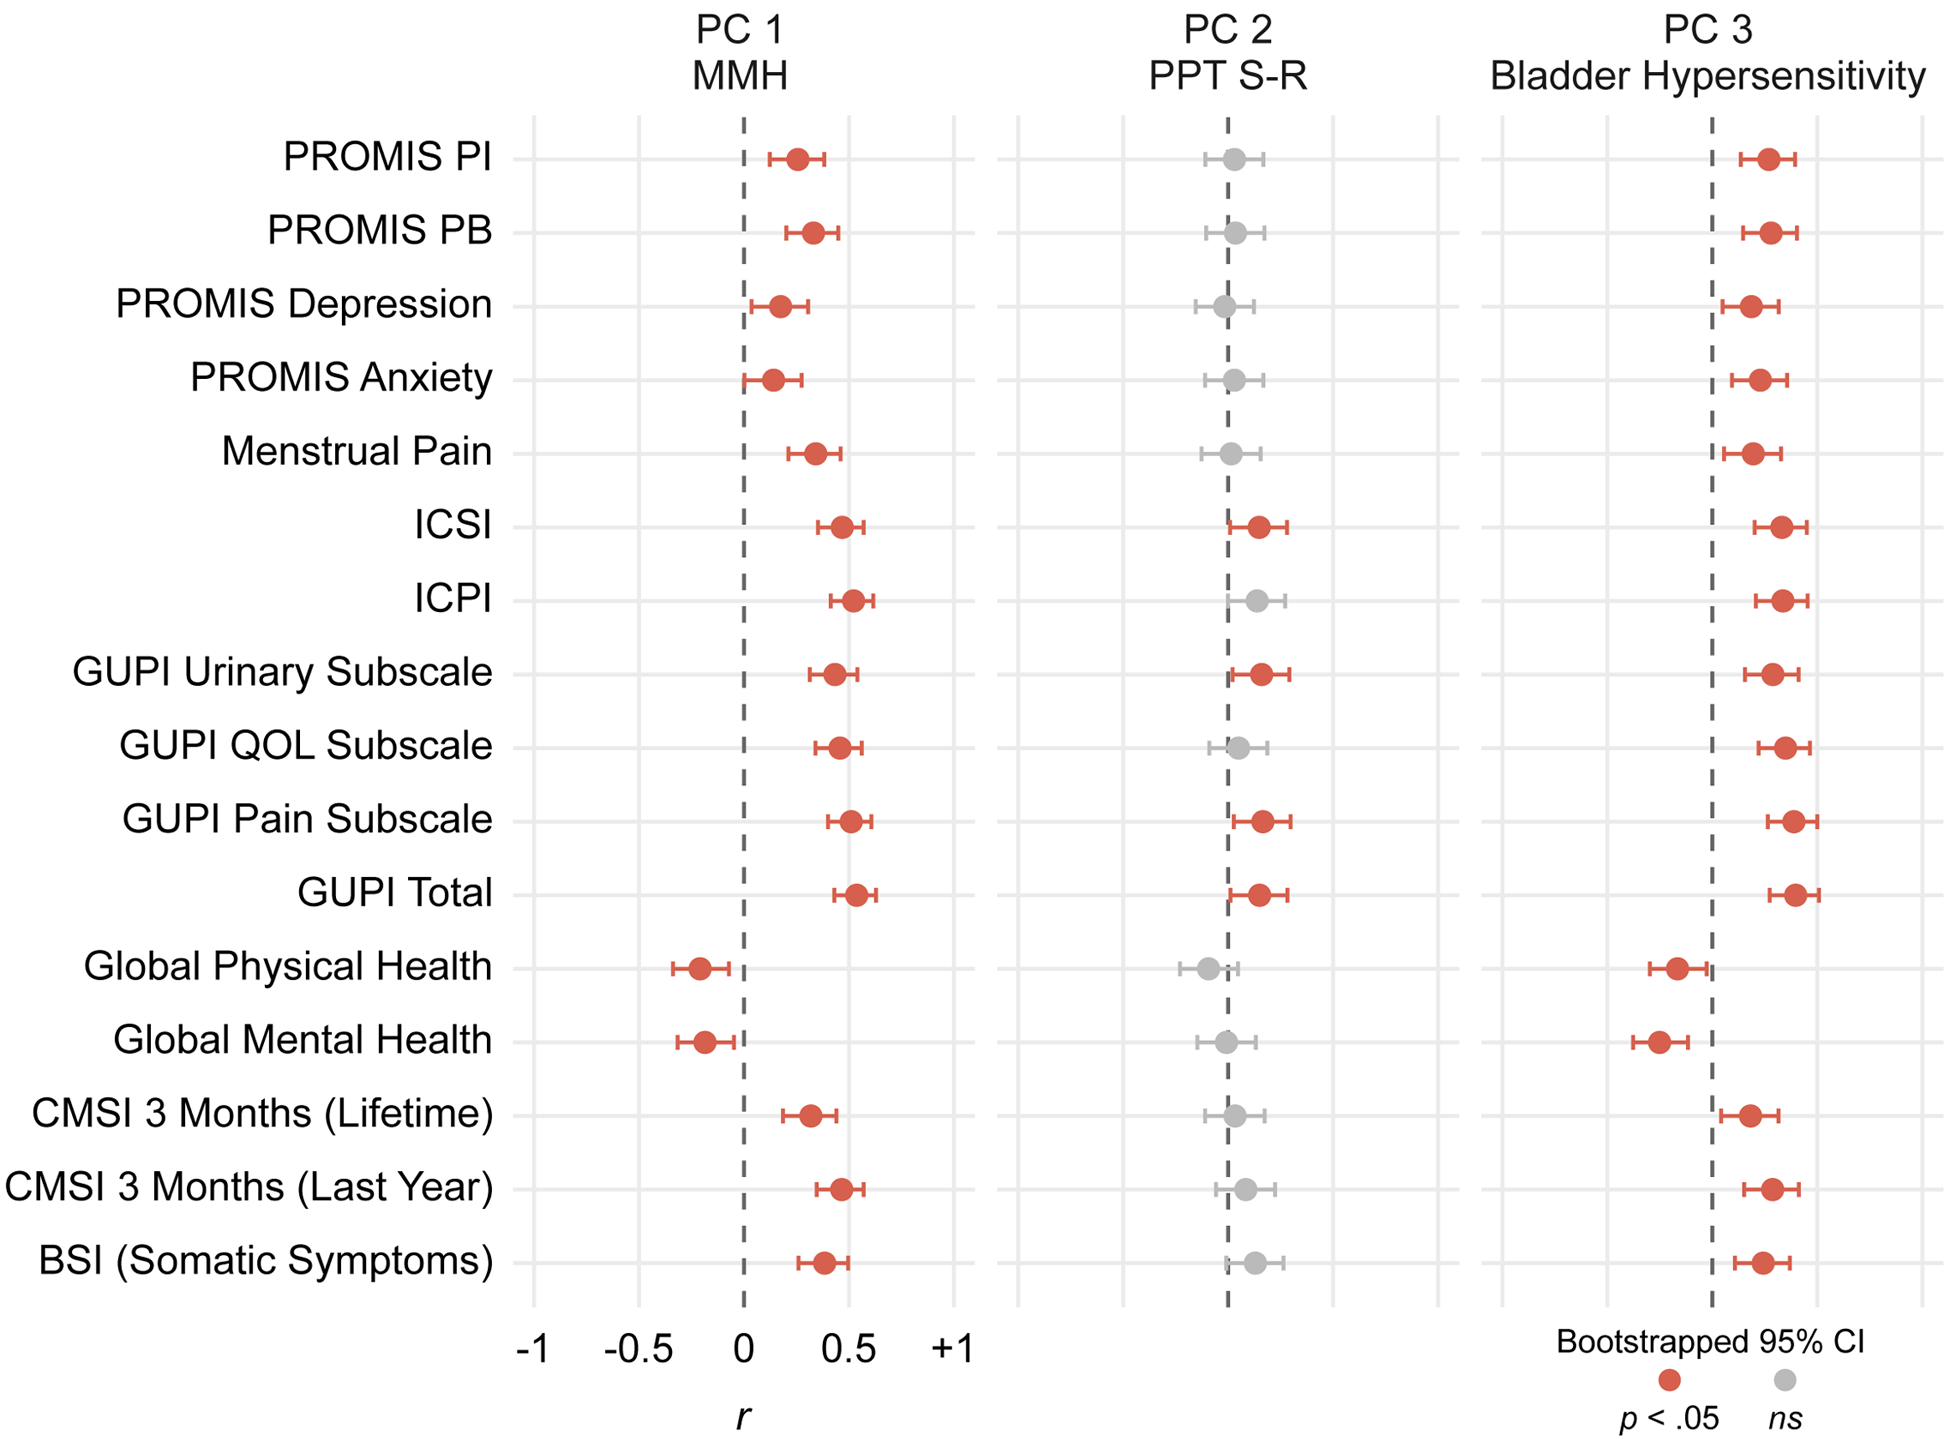
Figure 4. Correlations Between Principal Components (PCs) and Self-Report Questionnaires.

Each point depicts a Pearson’s pairwise correlation between the participants’ factor scores across the three PCs of interest and their responses to a self-report questionnaire. Error bars denote bootstrapped 95% confidence intervals; therefore, intervals crossing zero indicate non-significant correlations and are colored grey. Except for global mental/physical health, greater scores on self-report questionnaires denote worse symptoms/outcome. All MMH and bladder hypersensitivity correlations were significant and in the expected direction: greater hypersensitivity was associated with worse affective symptoms, somatic symptoms, genitourinary pain, menstrual pain, and overall pain and health. PROMIS=Patient Reported Outcomes Measurement Information System; PI=Pain Interference; PB=Pain Behavior; ICSI=Interstitial Cystitis Symptom Index; ICPI= Interstitial Cystitis Problem Index; GUPI=Genitourinary Pain Index; QOL=Quality of Life; CMSI=Complex Medical Symptoms Inventory; BSI=Brief Symptom Inventory.
