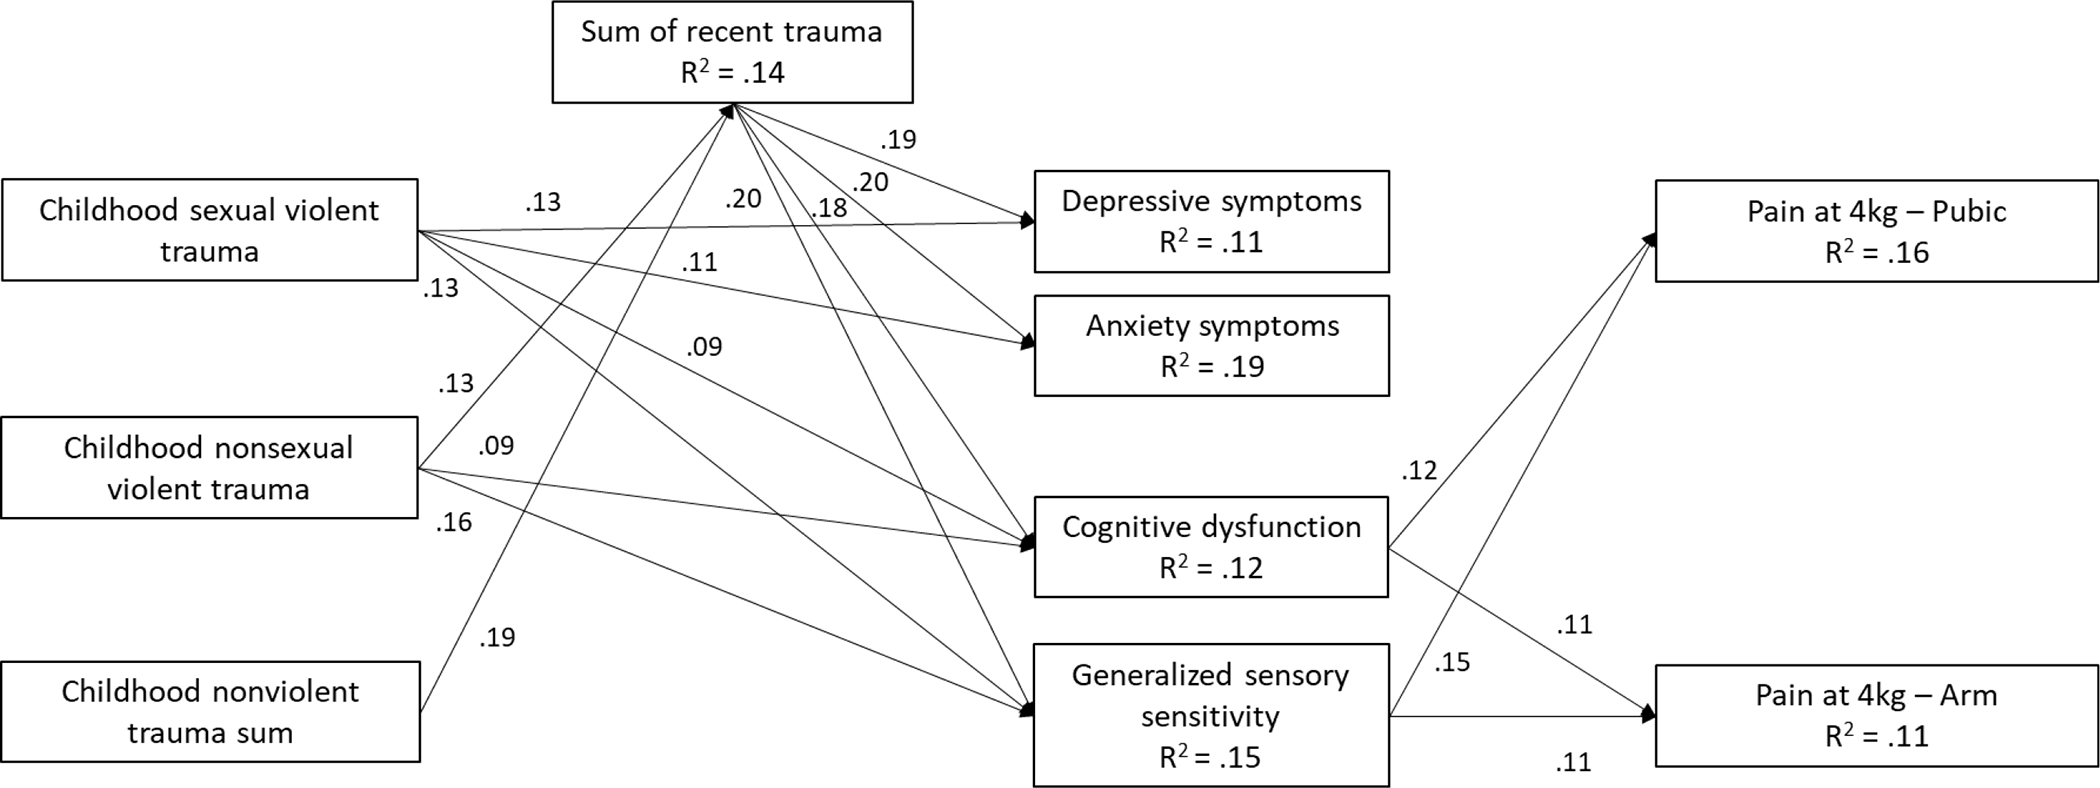
Figure 2.

Path model predicting pain sensitivity. Standardized estimates are shown. Only significant paths are shown. Covariates (age, college graduate, and sex) were included with direct associations on study variables. Covariance among variables at the same levels were also included. Covariates and covariance estimates, however, are not included in the figure to ease interpretability. Χ2 (df = 8) = 13.42, p = .098; RMSEA = .034 (90% CI [.000, .065]); CFI = .996; TLI = .965.
