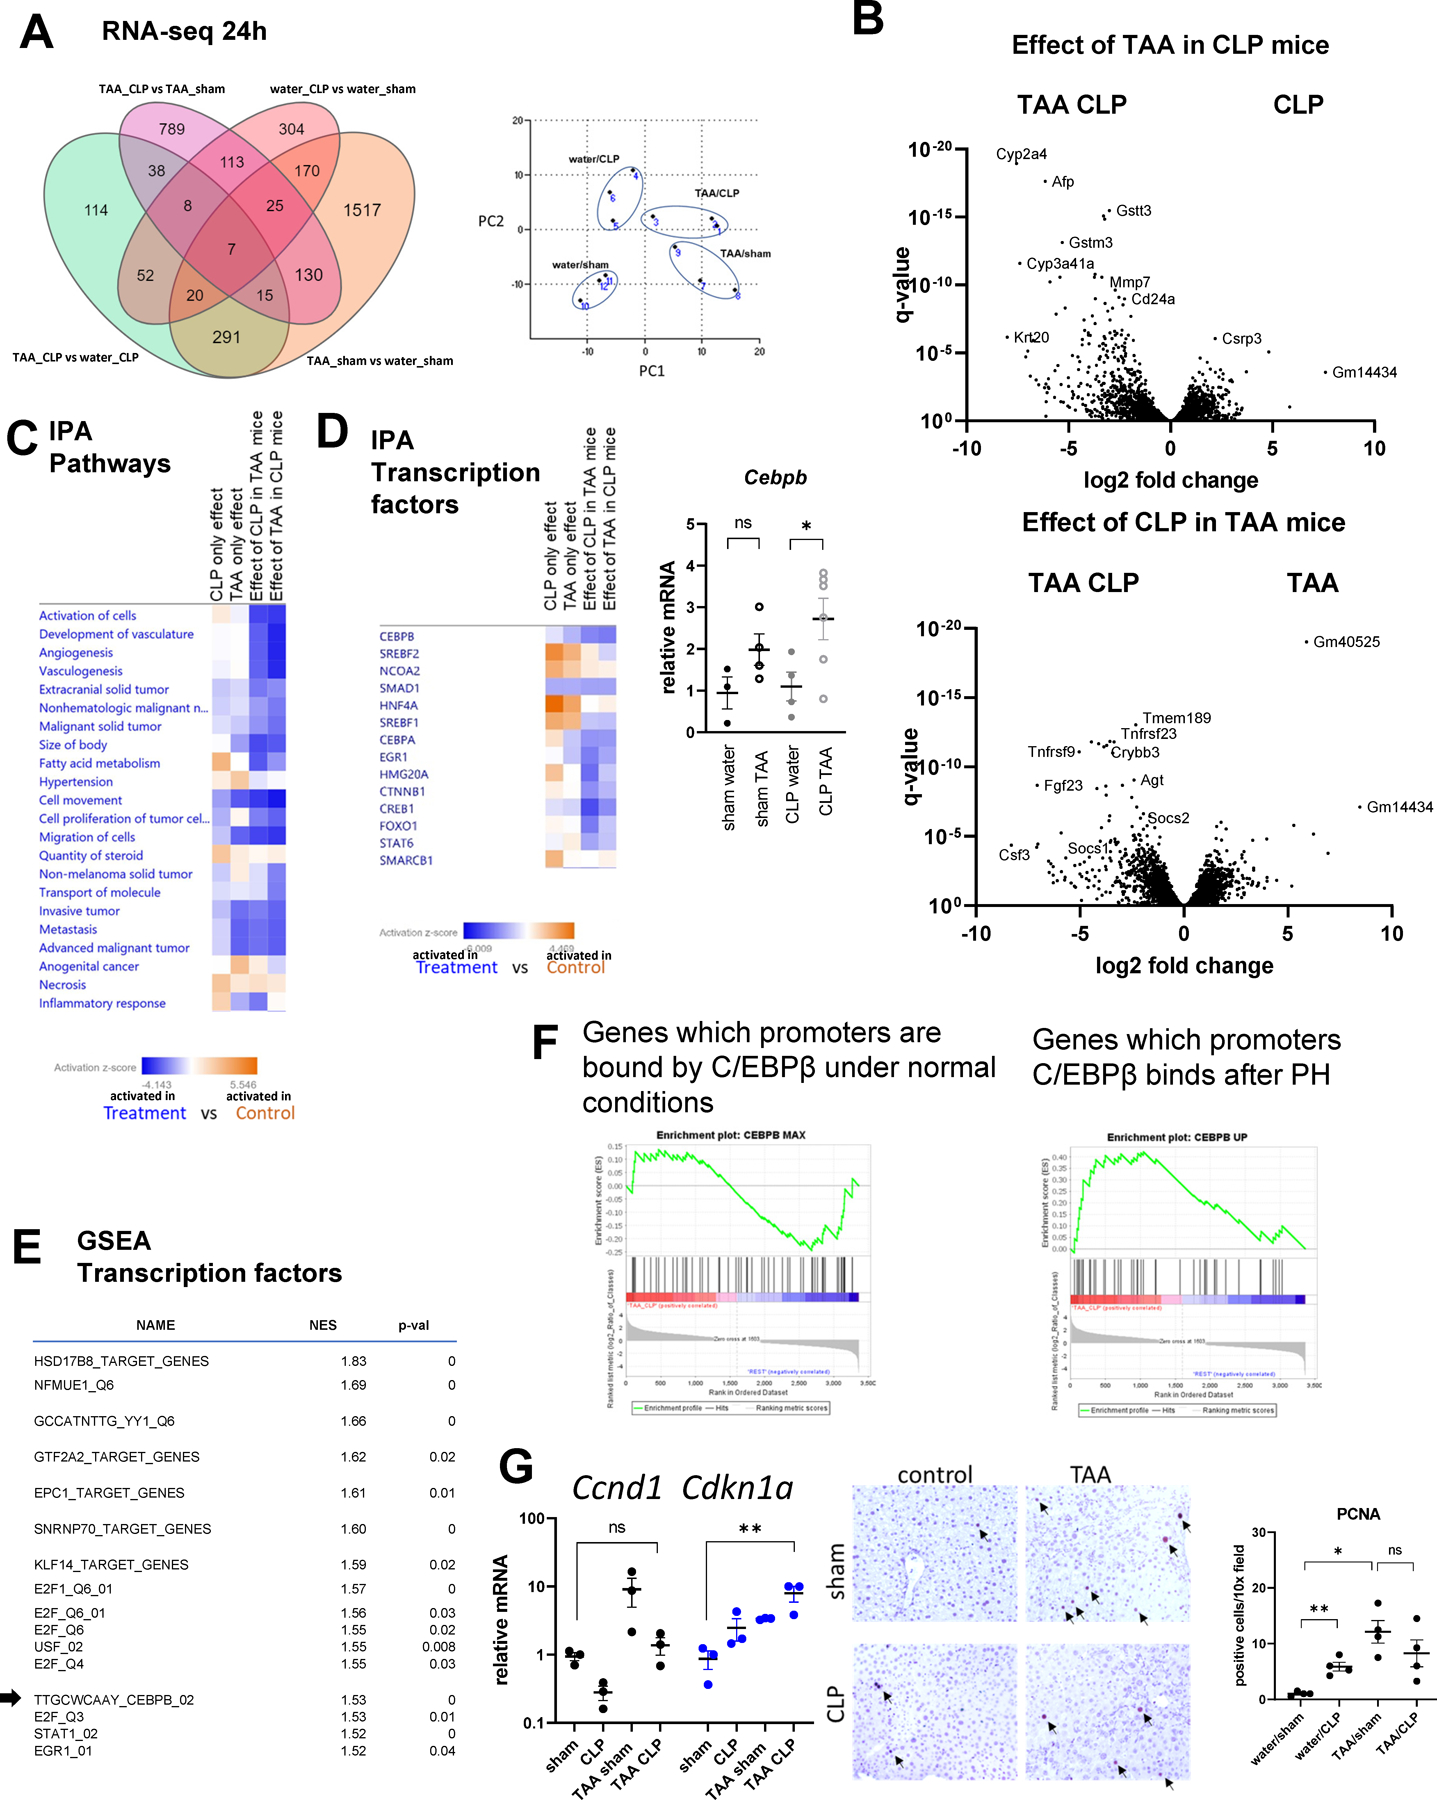
Figure 3. TAA and CLP combination results in unique transcriptional changes.

Mice (male and female) were treated with TAA and subjected to cecal ligation and puncture or sham surgery. Whole liver mRNA from 4 groups (3 mice per group) at 24h post-CLP was analyzed using RNA-seq. A. Number of differentially expressed genes in pairwise comparisons. Right. Principal component analysis. B. Volcano plots comparing TAA/CLP combination to single treatments. C-D. Ingenuity pathway analysis for each of the pairwise comparisons. Pathway and transcription regulators that are activated in treatment group (blue) and in control group (orange). Right. Cebpb gene expression in four groups of mice. *, P<0.05. E. Gene set enrichment analysis. Top transcription factors predicted to be activated in TAA/CLP group compared to all other groups. F. C/EBPβ target genes enrichment in genes activated in TAA/CLP group compared to the rest. G. Cell cycle and proliferation associated gene expression in four groups of mice. *, P<0.05, **, P<0.01. Middle. PCNA staining in four groups. Right. Average number of PCNA potive cells per 10x field. *, P<0.05, **, P<0.01.
