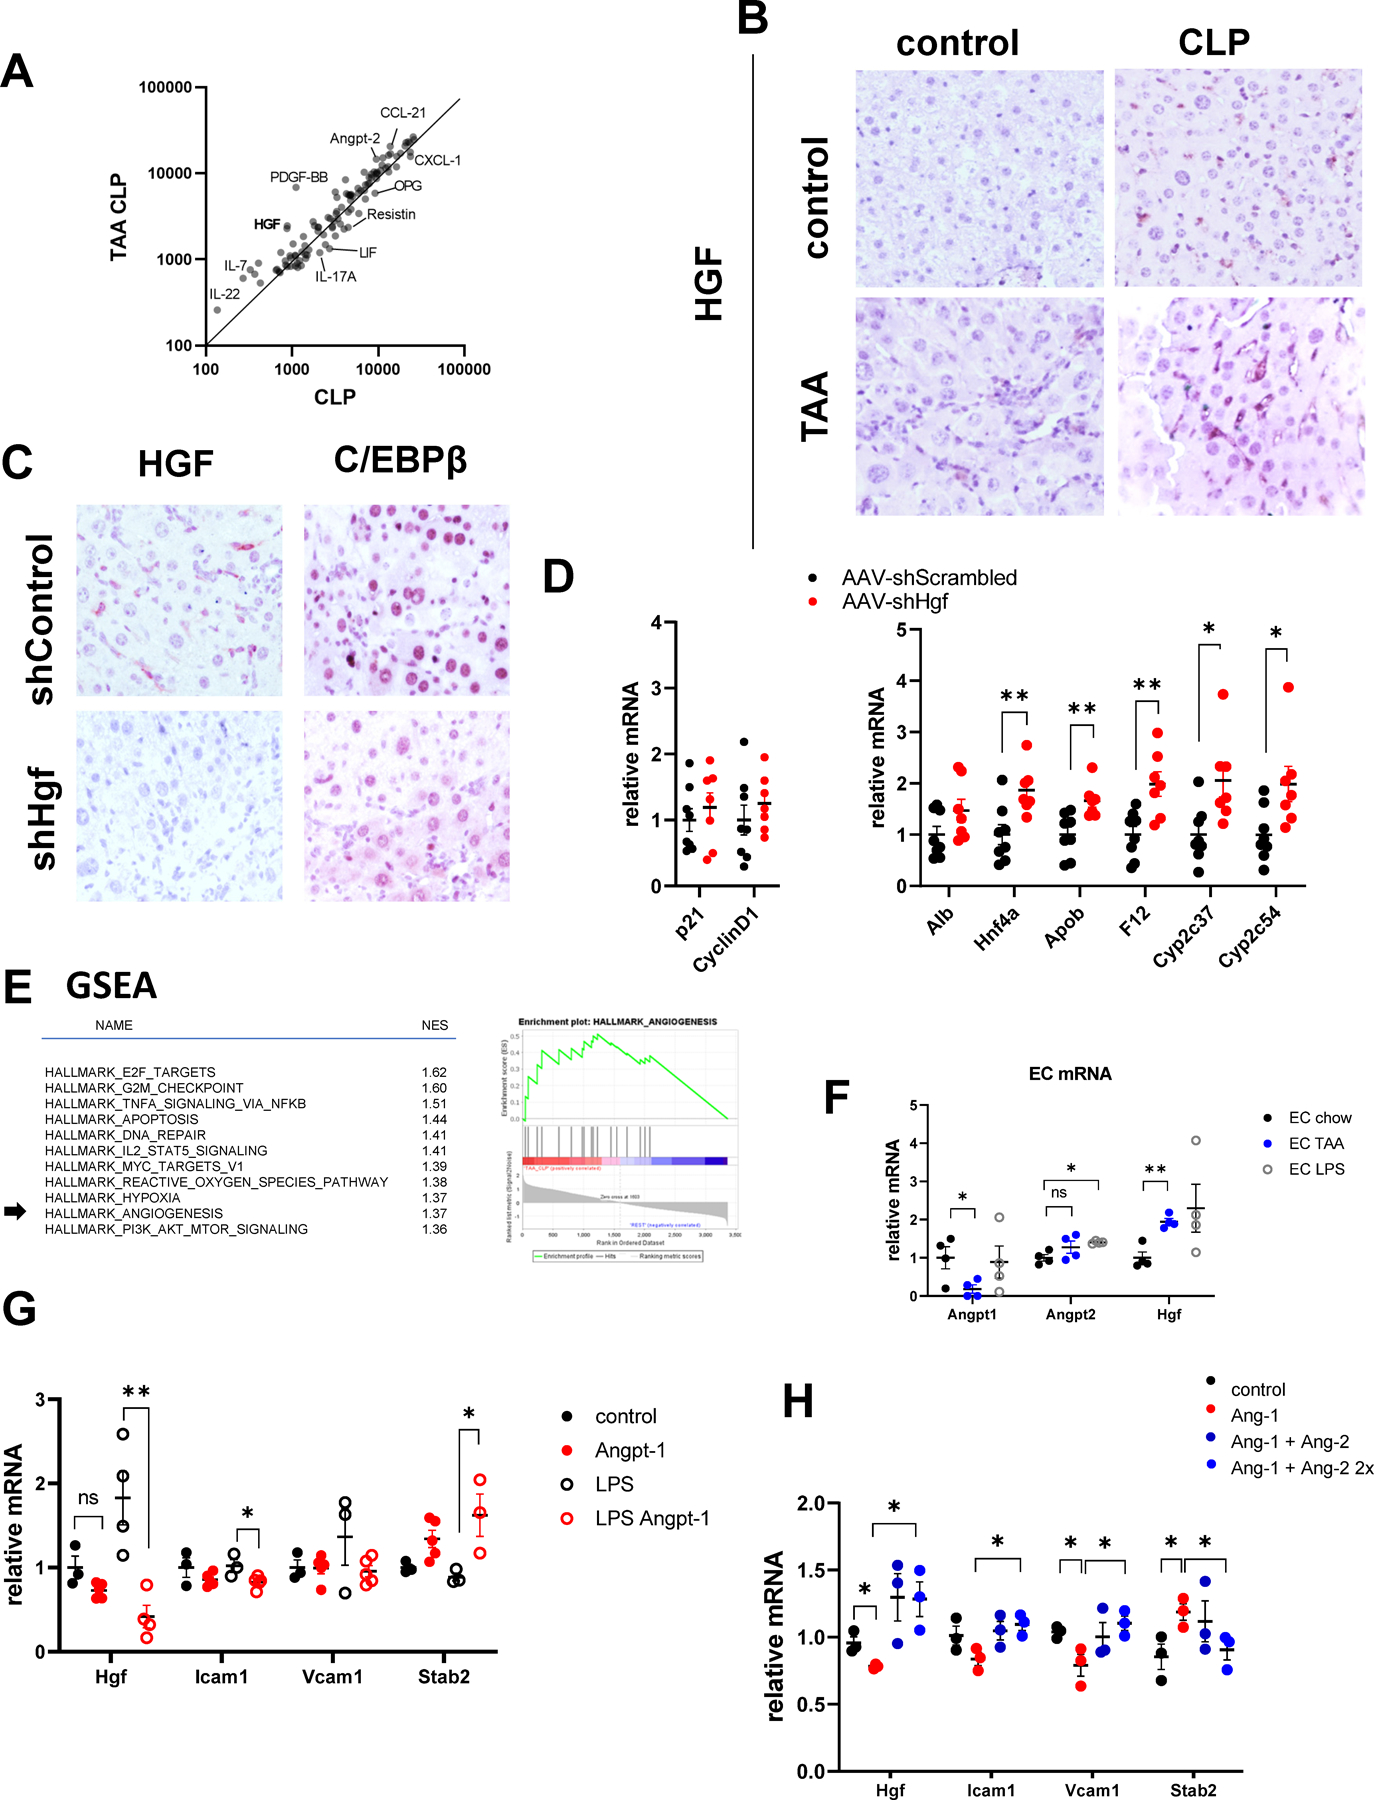
Figure 7. TAA and CLP combination causes endothelial cell dysfunction and HGF upregulation.

A. Serum samples from TAA/CLP and CLP mice (pooled from N=3 mice each) were used for cytokine array. Relative abundance of cytokines and circulating molecules in two groups. B. Liver section from indicated groups of mice at 24 hours post-CLP were stained using HGFα specific antibodies. C-D. Mice were treated with AAV.shScrambled or AAV.shHgf at 10^11 gc/mouse one week before CLP. C/EBPβ expression and relative gene expression in the livers of TAA/CLP mice 24 hours after CLP. E. Left. Gene set enrichment analysis. Top pathways predicted to be activated in TAA/CLP group compared to all other groups. Right. Angiogenesis genes enrichment in genes activated in TAA/CLP group compared to the rest. F. CD146 positive liver endothelial cells were isolated from control and TAA treated mice or treated with 100ng/ml of LPS. Relative gene expression. N=4 mice per group. G. LSECs were treated with recombinant Angiopoietin-1 (10 ng/ml) in the presence or absence of LPS for 48 hours. N=3–5. *, P<0.05, **, P<0.01. Unpaired t-test. LPS vs LPS Ang-1:Hgf P=0.006, Icam1 P=0.032, Stab2 P=0.045. H. LSECs were treated with recombinant Angiopoietin-1 (10 ng/ml) and Angiopoietin-2 (10 and 20 ng/ml). N=3 independent experiments. *, P<0.05 using paired ttest. Ang-1 vs control: Hgf P=0.040, Vcam1 P=0.048, Stab2 P=0.0096. Ang2+Ang1 vs Ang-1 Hgf P=0.049, Icam P=0.0002, Vcam1 P=0.009, Stab2 P=0.0079.
