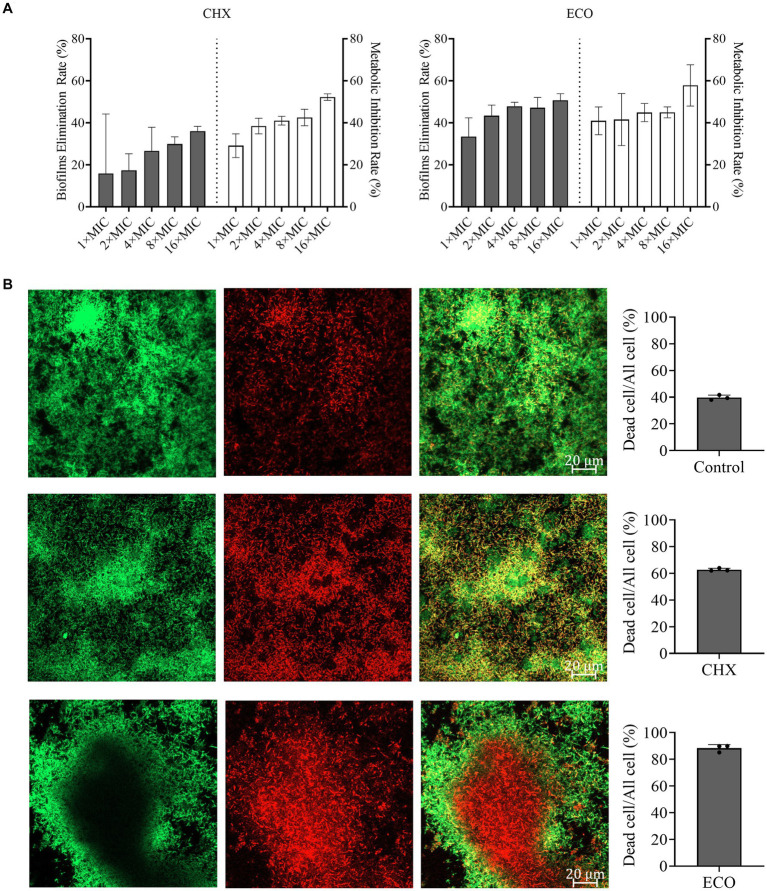
Figure 2.
Elimination F. nucleatum and P. gingivalis mixed biofilm and inhibition of bacterial metabolism by ECO. (A) Determination of the biofilm elimination and metabolic inhibition by CHX (left) and ECO (right). Grey bars indicate the biofilm elimination rate and white bars indicate the metabolic inhibition rate. (B) CLSM observation of the mixed biofilms stained by the combination of SYTO9 (green) and PI (red) with or without the treatment (left, bar indicates 0.2 μm in the merged images). In the right panel, grey columns show the ratio of dead cells in the corresponding groups.

