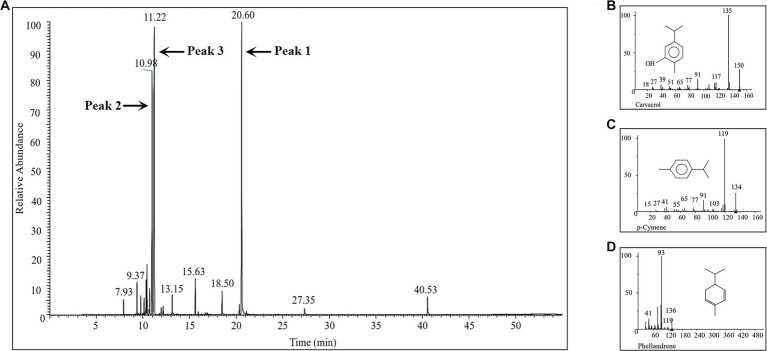
Figure 3.
GC-MS analysis of the chemical composition of the prepared ECO sample. (A) TIC of the GC-MS. (B) Mass spectrum of peak 1 in panel (A), which was identified as carvacrol. (C) Mass spectrum of peak 2 in panel (A), which was identified as p-cymene. (D) Mass spectrum of peak 3 in panel (A), which was identified as phellandrene.

