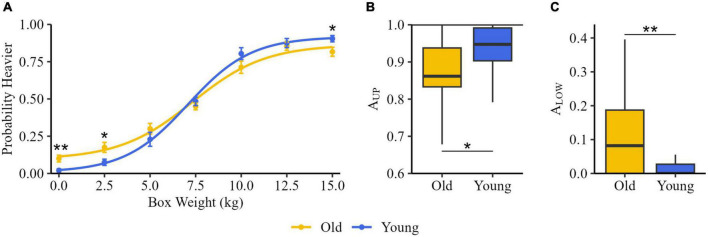
FIGURE 3.
Weight discrimination. (A) Psychometric functions for older adults (Old, yellow) and young subjects (Young, blue). Dots represent the proportion of Heavier responses at comparison stimulus for each group, obtained from the average of the responses of all participants. (B) Lower asymptotes (ALOW) and (C) upper asymptotes (AUP) and for old and young groups. The black horizontal line indicates the median, the box represents the inter-quartile ranges, and the bars show the maximum and the minimum. *p < 0.05, **p < 0.01.

