. 2023 Aug 21;13(35):24835–24845. doi: 10.1039/d3ra04488b

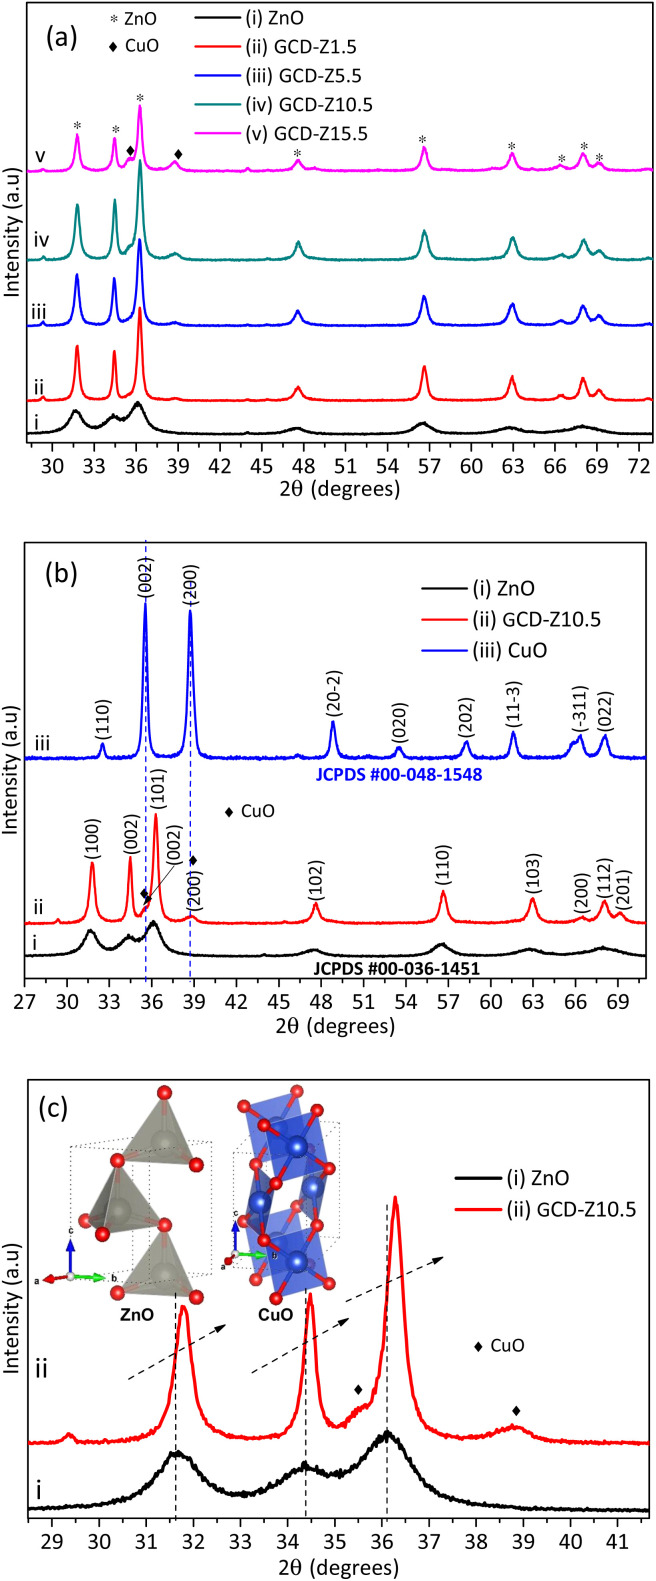
Fig. 2. XRD pattern of ZnO and CuO NPs and GCD-Zs nanocomposites: (a) XRD patterns of ZnO and different percentages of GCD-Zs (1.5–15.5%), in which the crystallinity increases with dopant%; (b) XRD patterns of ZnO and CuO NPs and GCD-Z10.5; here, the CuO phase was detected at 35.5 and 38.7° on the GCD-Z10.5; (c) magnified view of the XRD pattern for ZnO NPs and GCD-Z10.5; there is a higher angle shift on the XRD pattern of GCD-Z10.5 than single ZnO, confirming the copper inclusion in the ZnO lattice. The inset in (c) is the polyhedral structure models of ZnO and CuO crystals developed by the software 3D Visualisation for Electronic Structural Analysis (3D-VESTA) from the crystallographic information file (CIF) data.

Fig. 2