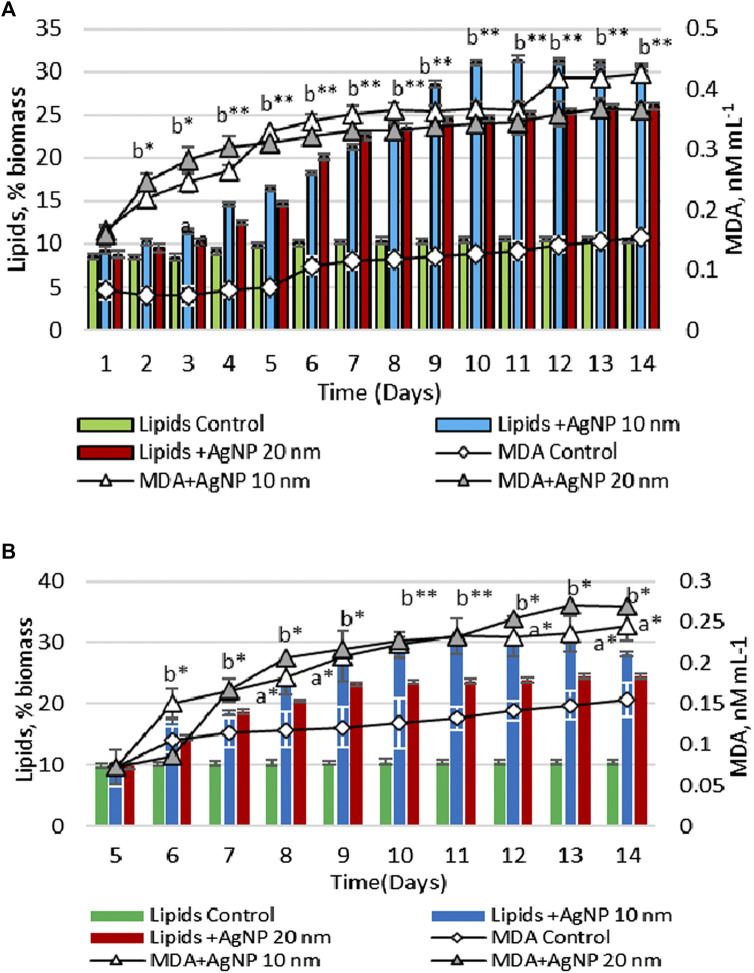
FIGURE 4.
Total lipid and MDA contents in the biomass, upon the exposure of Porphyridium cruentum during the lag phase (A) and exponential growth phase (B) to 10 µM AgNP 10 nm and 10 µM AgNP 20 nm; a -p < 0.01; b -p < 0.001; a*-p < 0.01 common for two parameters; b*-p < 0.001 common for two parameters; b**-p < 0.001 common for all parameters.

