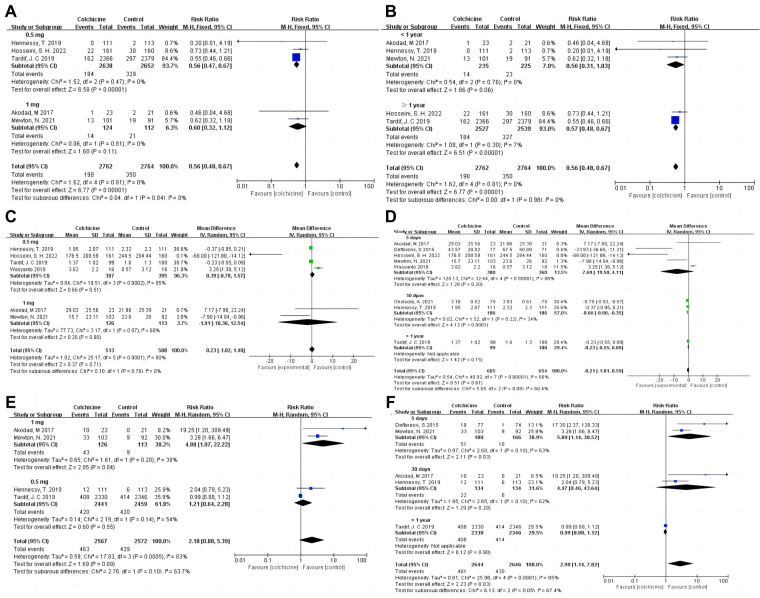
Figure 4.
Forest plot showing subgroup analysis in patients with AMI treated with different follow-up duration or dosages of colchicine. (A) MACE at different dosages; (B) MACE at difference follow-up times; (C) CPR at difference dosages; (D) CRP at difference follow-up times; (E) Gastrointestinal adverse events at difference dosages; (F) Gastrointestinal adverse events at difference follow-up times.

