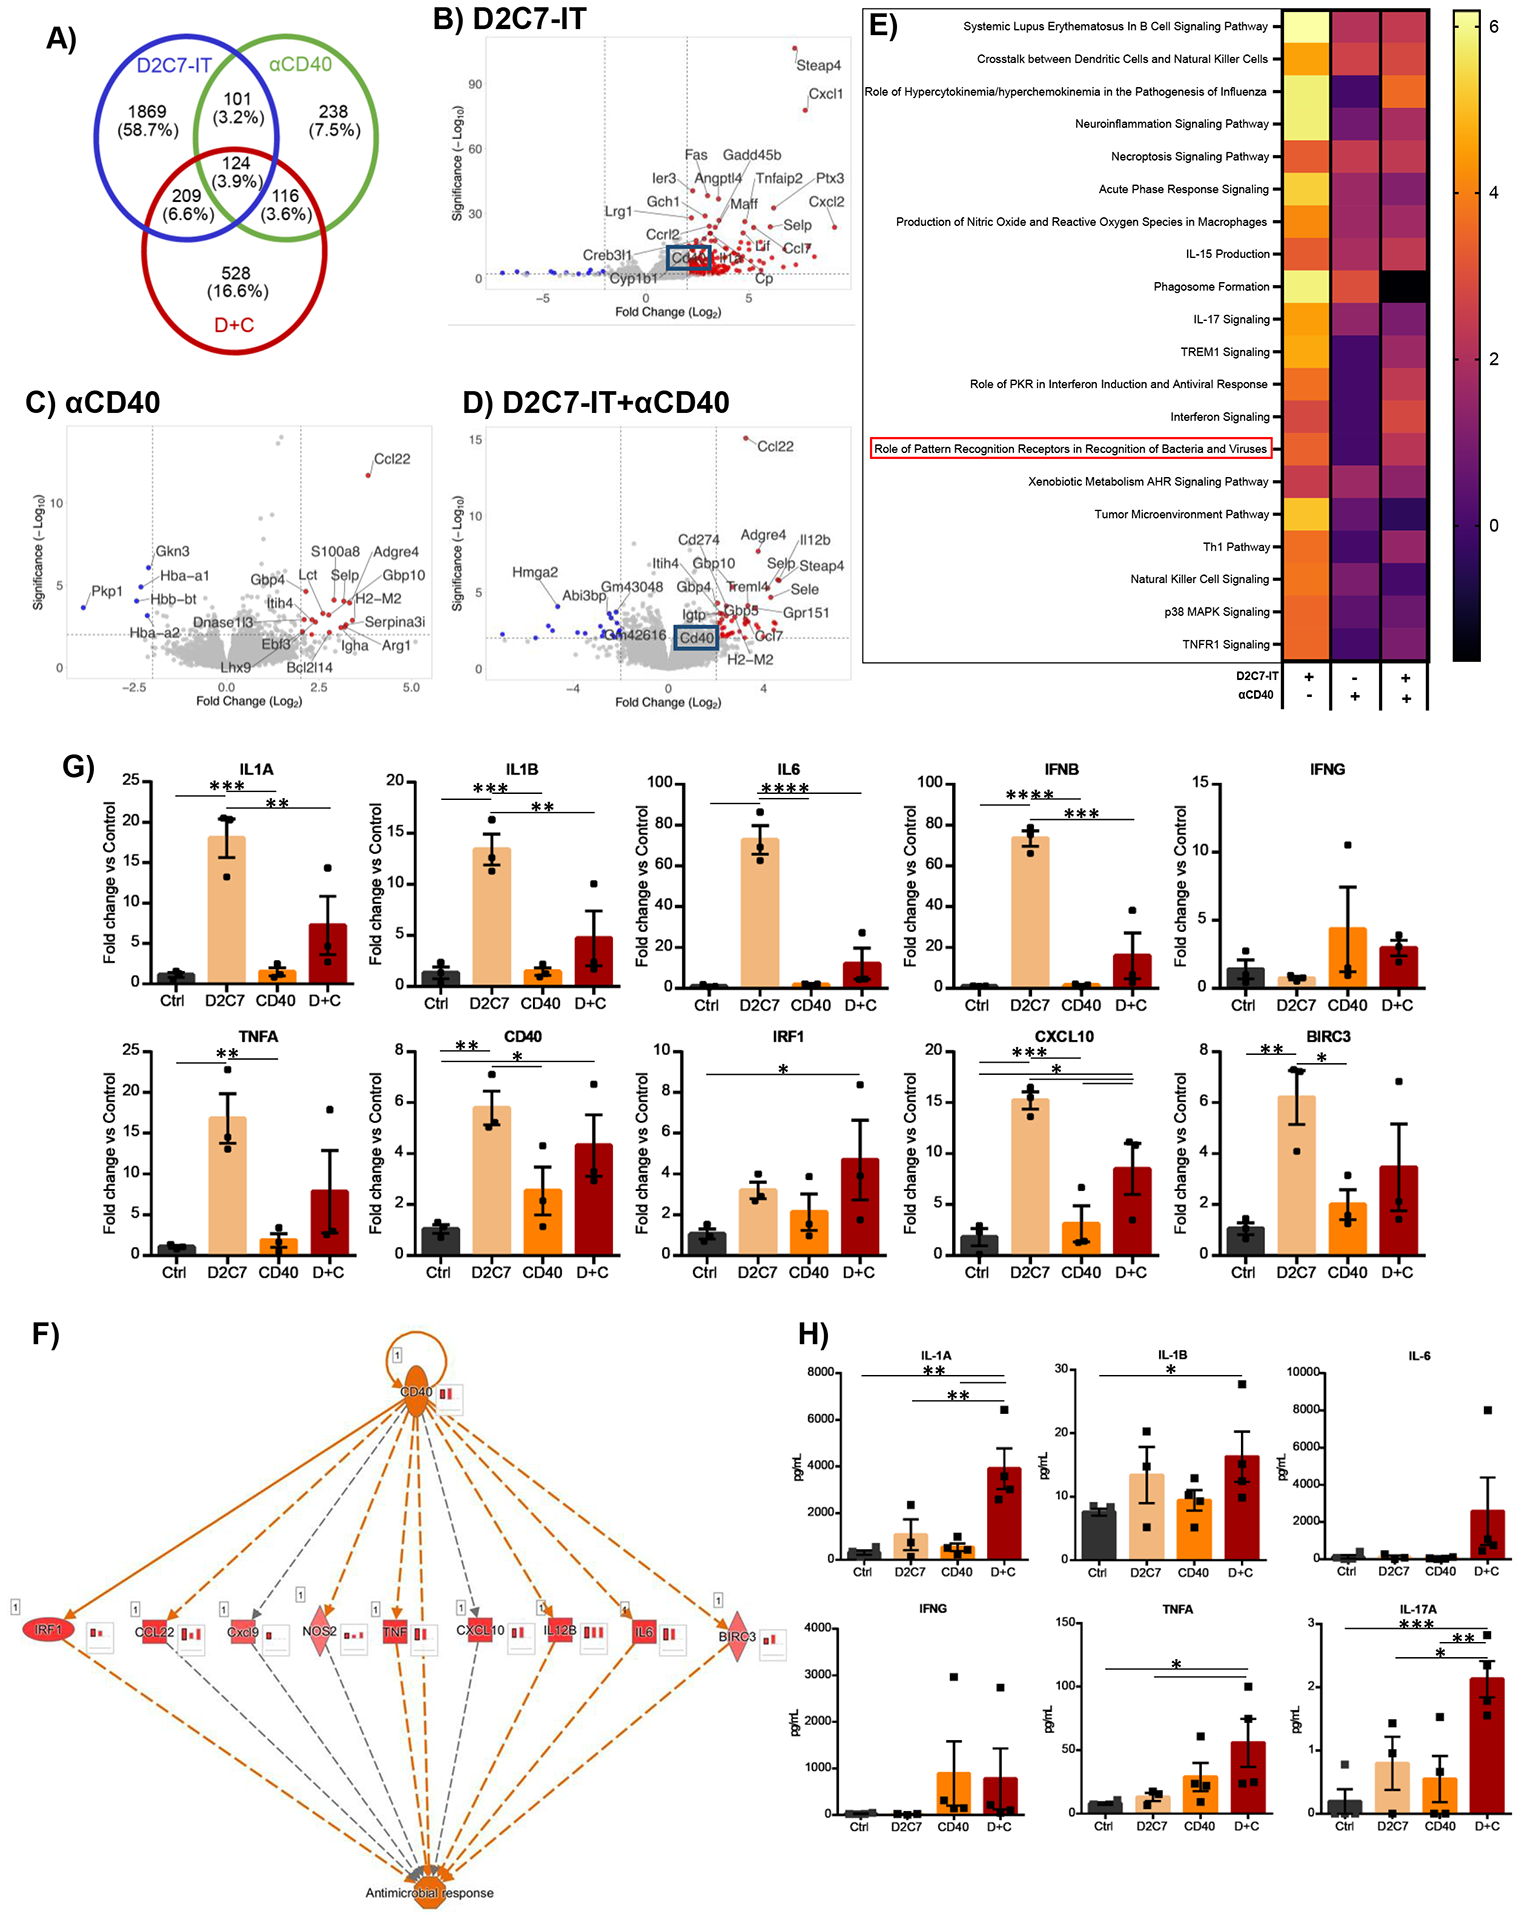
Fig. 8. D2C7 and D+C therapies instigate proinflammatory transcriptional and cytokine changes in the tumor microenvironment in the CT-VIII glioma model.

(A) Venn diagram of differentially expressed genes (up- and down-regulated compared to control group) in D2C7, αCD40, and D+C groups by RNA-Seq analysis of CT-VIII gliomas post 72 hr CED (n=3/group). (B-D) Volcano plots depicting the log2(fold change) in gene expression in D2C7 (B), αCD40 (C), and D+C (D) treated versus control tumors post 72 hr CED. Top 25 differentially expressed with P<0.05 are shown in red (upregulated) and blue (down-regulated). (E-F) Heatmap of z-scores of Top 20 IPA Canonical Pathway (E) and IPA CD40 regulatory network (F) gene transcripts in D2C7, αCD40, and D+C treated versus control tumors post 72 hr CED. The red bar charts in insets next to each gene represent the amount of activation in D+C (left), D2C7(middle), and αCD40 (right) treated versus control tumors post 72 hr CED. (G) The qPCR gene expression analysis of D2C7, αCD40, and D+C treated versus Ctrl tumors post 72 hr CED (n=3/group) in CT-VIII model. Data indicate the mean fold change over control after normalization to the average of ACTB housekeeping gene.
(H) Cytokine concentrations in tumor lysates of D2C7, αCD40, and D+C treated versus Ctrl tumors post 72 hr CED (n=3–4/group) in CT-VIII model. *P<0.05, **P<0.01, ***P<0.001, ****P<0.0001. Data are mean ± SEM.
