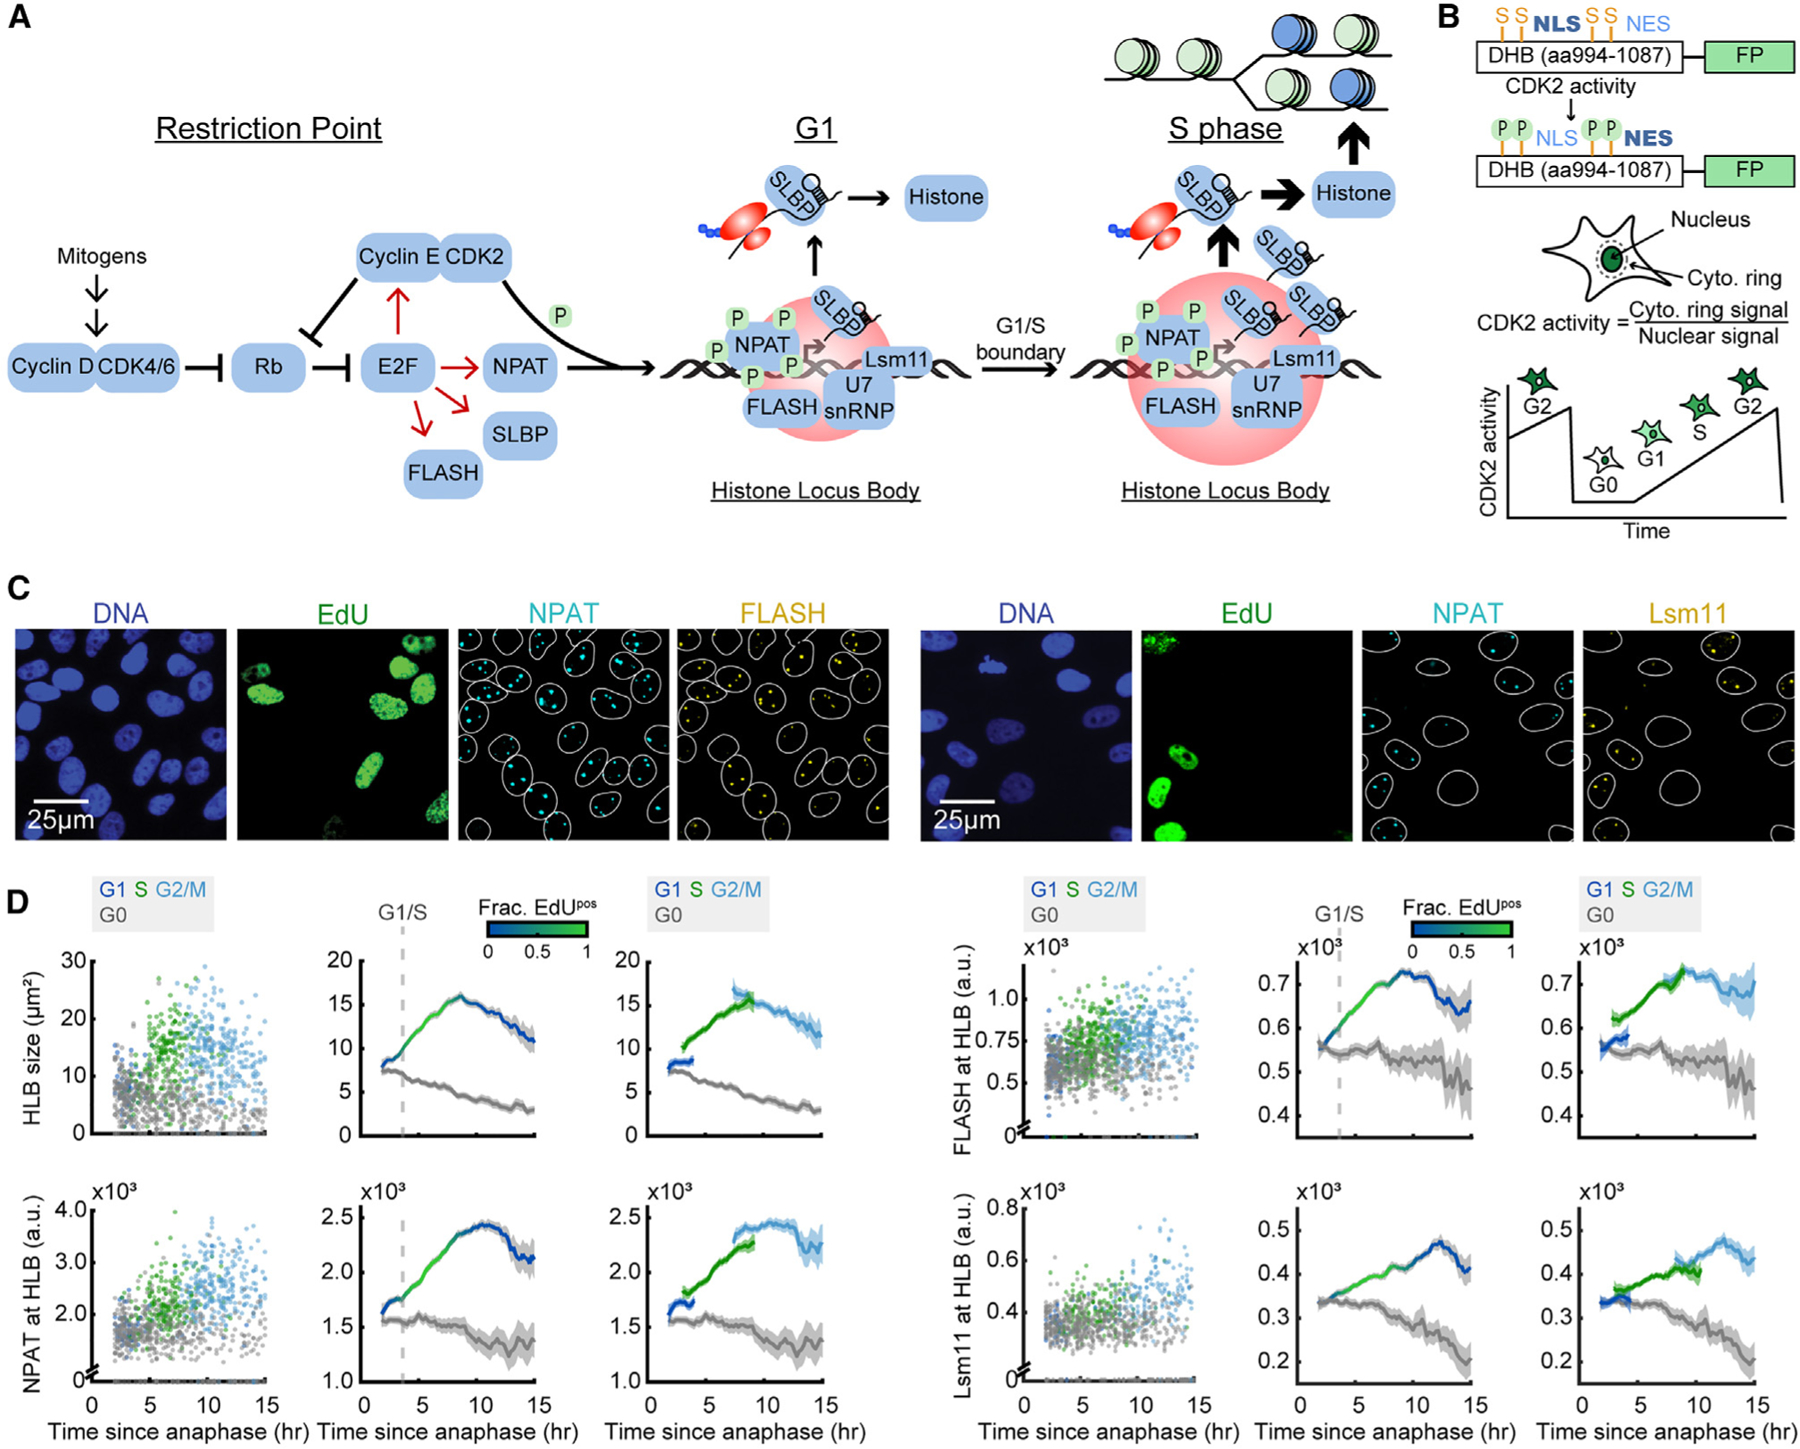
Figure 1. HLB factors are recruited in G1 and retained through the cell cycle.

(A) Schematic of histone biosynthesis relative to the restriction point and cell-cycle progression.
(B) Schematic of the CDK2 sensor and live-cell tracking.17
(C) Representative images of cells following time-lapse imaging, stained for DNA content, EdU, NPAT, and either FLASH or Lsm11.
(D) Column 1: raw single-cell data by cell-cycle phase. CDK2 activity was tracked using time-lapse microscopy followed immediately by cell staining of individual cells’ immunofluorescent signal at the HLB as a function of time since anaphase. Cells are color-coded according to whether they are in G0 (CDK2low cells), G1 (CDK2inc, 2N, and EdUneg), S (CDK2inc and EdUpos), or G2/M (CDK2inc, 4N, and EdUneg) during the staining immediately following the last frame of the movie. Column 2: average of each cell’s immunofluorescence signal and 95% confidence intervals as a function of time since anaphase for CDK2inc and CDK2low populations. The G1/S transition is marked as the time when 50% of cells are EdUpos (dashed line). Column 3: CDK2inc population from column 2 segmented into G1, S, and G2/M (see also Figure S1).
Information on biological and technical replicates can be found in Table S2.
