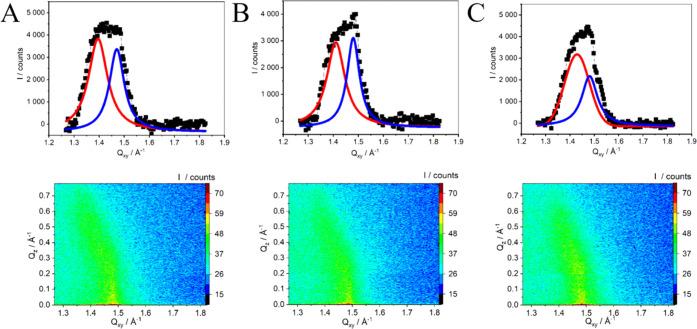
Figure 4.
GIXD Qz-integrated Bragg peak profiles and corresponding QZ–QXY intensity maps for SM Langmuir monolayers compressed to 30 mN/m on (A) PBS buffer, pH = 7.4 and PBS containing (B) 10–5 M FLU and (C) 10–5 M CER. Solid black points are experimental data, and red and blue lines are Lorentz curve fits.

