Figure 3.
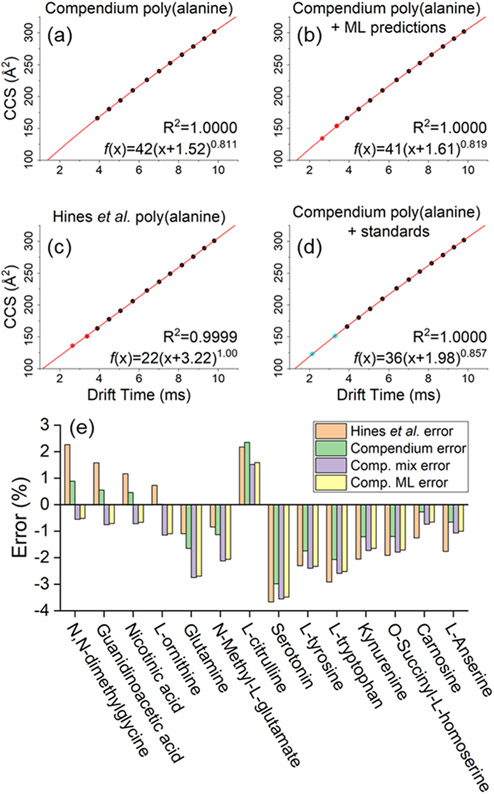
Accuracy of four CCS calibration strategies was evaluated using a panel of 14 standards covering the 104–241 m/z range. Plot (a) shows a power law calibration curve using Unified CCS Compendium11 data covering poly(alanine) oligomer lengths n = 4–14 (black points). To further extend the range of calibration, this series may be extended using ML predicted CCS values for poly(alanine) n = 2–3 (red points) as shown in plot (b) or by using poly(alanine) data from an alternate source (c). Alternatively, the poly(alanine) series may be supplemented with additional standards as in (d) where dimethylglycine and tryptophan (blue points) were used. CCS values for these 14 standards were calculated using each of the four power-law calibration curves, and then compared against Unified CCS Compendium11 reported values for each standard. Errors for each calibration procedure are shown in (e).

