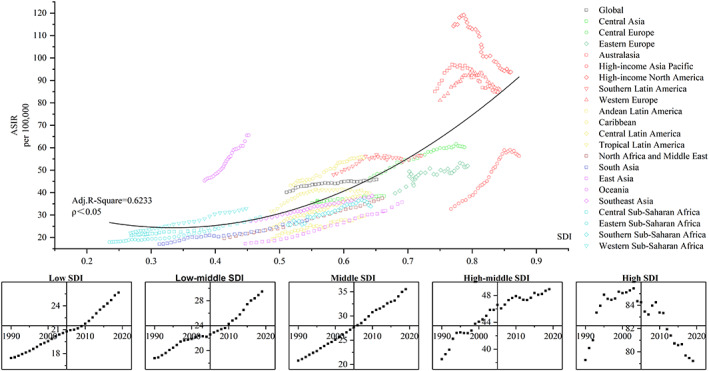
FIGURE 5.

Age‐standardized DALY rates for FBC by 21 global burden of disease regions by Socio‐demographic Index (SDI), 1990–2019. (Source: (1) Figure 5 includes six figures, and the detailed subgroups are listed as follows: up: The relationship between ASIR and SDI globally and in the 21 GBD regions; down: The five figures represent the temporal trends of ASIR from 1990–2019 for Low SDI, Low‐middle SDI, Middle SDI, High‐middle SDI, and High SDI, respectively. (2) SDI, sociodemographic index; ASIR, age‐standardized incidence rate; Adj. R‐square, adjusted R‐square. (3) The solid black line represents expected values based on SDI from a regression of all location data over the entire 1990–2019 estimation period)
