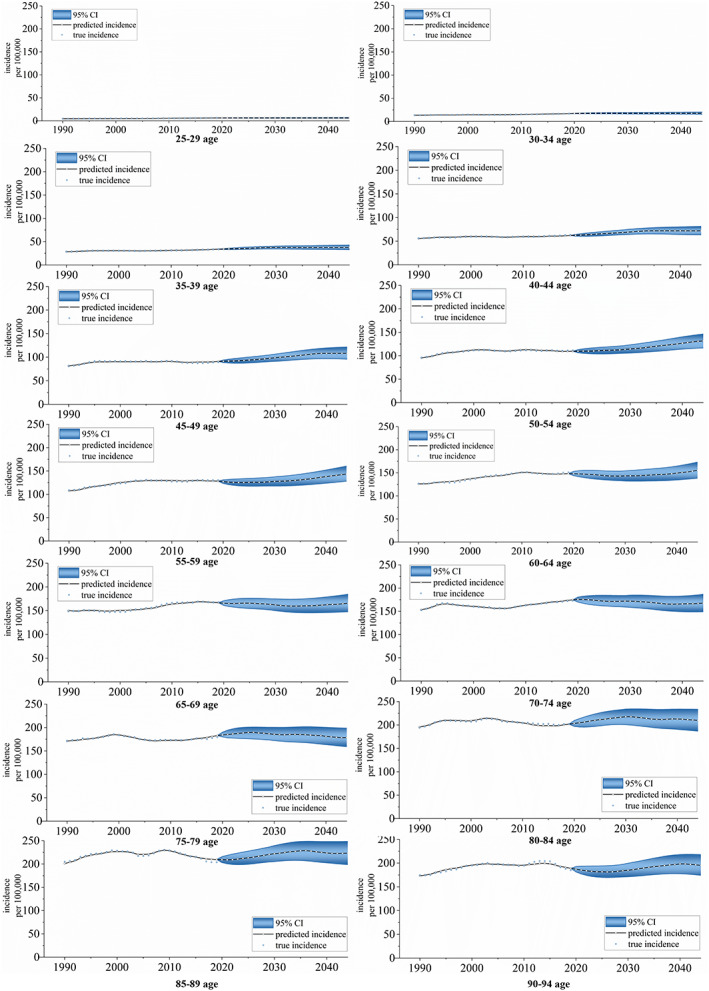
FIGURE 6.

Incidence for FBC projections at the global level for 25–94‐year‐olds at five‐year age intervals, 2020–2044. (Source: Figure 1 includes 14 figures, and the detailed subgroups are listed as follows: from top to bottom, from left to right: 25–29 age group, 30–34 age group, 35–39 age group, 40–44 age group, 45–49 age group, 50–54 age group, 55–59 age group, 60–64 age group, 65–69 age group, 70–74 age group, 75–79 age group, 80–84 age group, 85–89 age group, and 90–94 age group)
