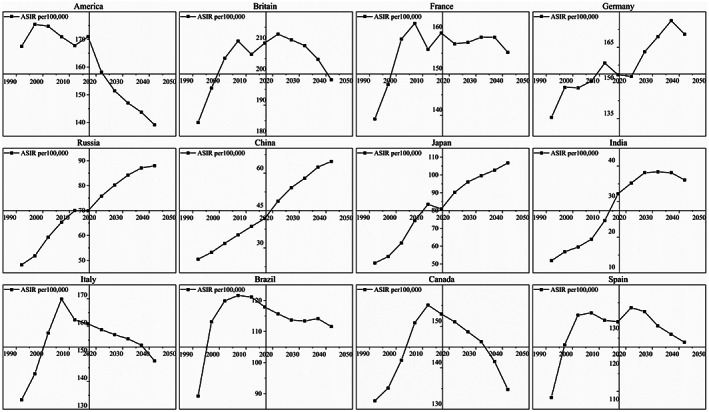
FIGURE 8.

Temporal trends of ASIR in selected countries in 1990–2044. (Source: Figure 8 includes 12 figures, and the detailed subgroups are listed as follows: The ASIR of FBC for some selected countries from 1990 to 2044, from top to bottom, from left to right: America, Britain, France, Germany, Russia, China, Japan, India, Italy, Brazil, Canada, and Spain)
