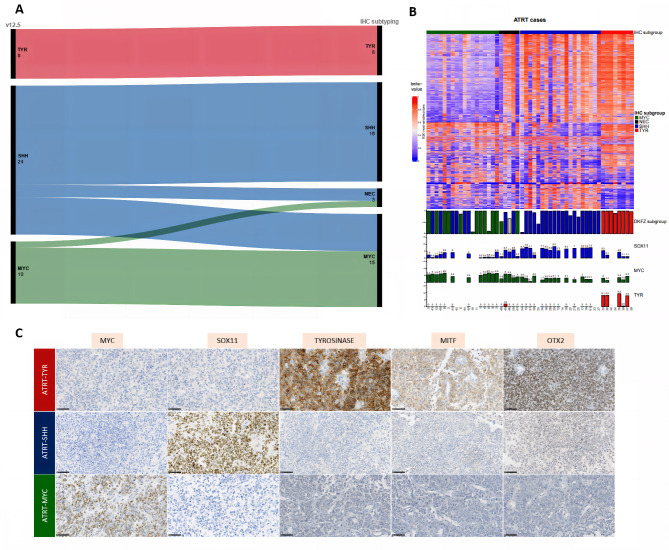
Fig. 1.
Comparison of molecular sub-typing by DNA-methylation analysis and immunohistochemistry. A: Alluvial diagram showing the assignment to subgroups by IHC subtyping using the panel 5 (left) and DNA-methylation profiling using the version v12.5 of the classifier. Cases with a calibrated score ≤ 0.9 were included in the “no match” group. B: Heatmap of DNA methylation beta-value using the top 5000 most variable probes. Samples are grouped according to the AT/RT subgroup predicted by our IHC method (top annotation). Unsupervised hierarchical clustering was applied to probes using Euclidean metric and Ward linkage. Sample subgroups identified using the DKFZ brain tumor classifier are plotted in the first layer of bottom annotation with the color indicating the AT/RT subgroup (red: TYR, blue: SHH and green: MYC). The height of the bar corresponds to the classification score (from 0 to 1). The three other layers of bottom annotation indicate respectively the expression level of SOX11, MYC and TYR genes in log2(TPM + 1) whenever RNA-seq data were available. C: A representative case with immunohistochemical findings for all subgroups (magnification x400). Black scale bars represent 50 μm
Comparison of molecular sub-typing by DNA-methylation analysis and immunohistochemistry
IHC: immunohistochemistry; NEC: Not Elsewhere Classified (the tumor was not classified in a subgroup)

