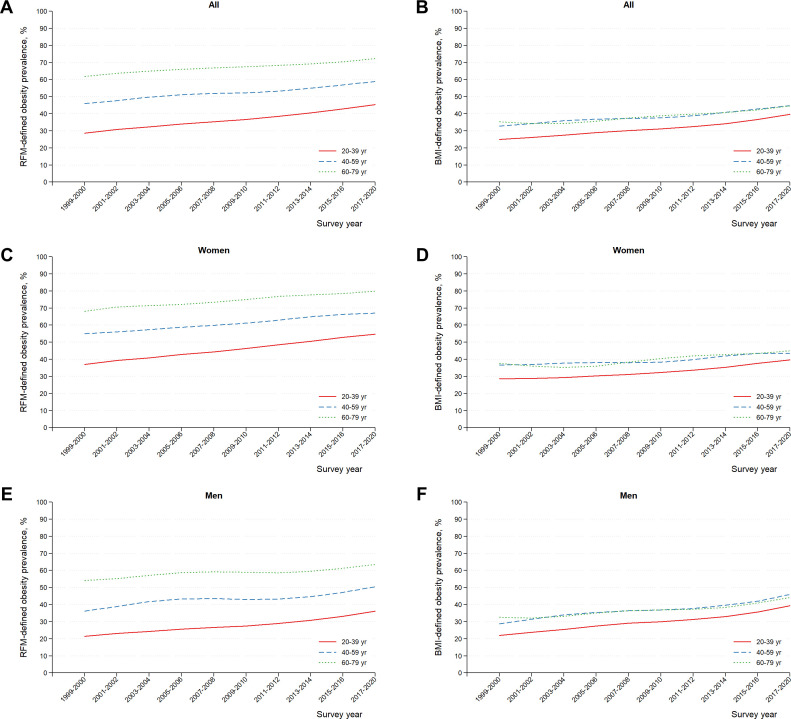
Figure 3.
Age-adjusted US adult prevalence temporal trends in RFM-defined obesity by age group: 1999–2000 to 2017–March 2020. Trend lines were smoothed using the LOWESS method on weighted prevalence estimates. The RFM was calculated as follows: RFM=64−(20×height/waist circumference)+(12×sex); sex equals 0 for men and 1 for women. Obesity was diagnosed if RFM was 40% or higher for women and RFM was 30% or higher for men. LOWESS, locally weighted scatterplot smoothing; RFM, relative fat mass.

