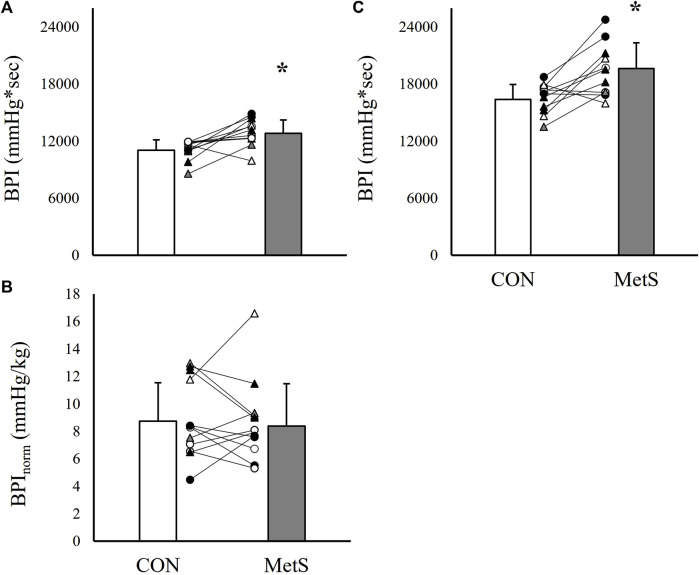
FIGURE 2.
Total area under the curve for mean arterial pressure [BPI; (A)] and BPI normalized to the time-tension index [BPInorm; (B)] recorded during 2 minutes of handgrip exercise (35% MVC) compared between individuals with (MetS) and without (CON) metabolic syndrome. Panels (C) represent BPI responses recorded during 3 minutes of post-exercise circulatory occlusion. Black filled symbols represent Black/African American participants, white filled symbols represent White participants, gray filled symbols represent Asian participants, circles represent male participants, and triangles represent female participants. Lines connecting raw data points indicate participants matched for age, biological sex, race, and ethnicity. Data presented as mean ± standard deviation, * indicates a statistically significant difference compared to the control group (p < 0.05).

