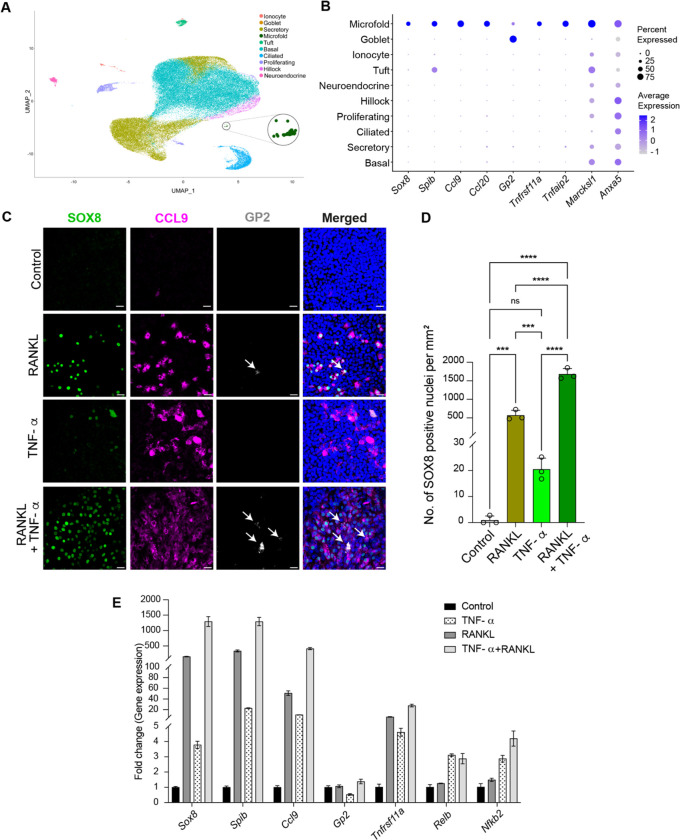
Figure 1.
M cell transcriptomes and mechanisms of in vitro differentiation. (A) Dimensionality reduced visualization using Uniform Manifold Approximation and Projection (UMAP) of scRNA-seq transcriptomes of tracheal epithelium showing a newly identified M cell cluster (circled and enlarged). (B) Dot plot showing that M cells express characteristic M cell transcription factors, chemokines, receptors, and other M cell markers. (C-E) Mature ALI epithelial cultures derived from primary murine basal stem cells from the trachea were treated daily for 6 days with RANKL (200 ng/ml), TNF-α (50 ng/ml), or combined RANKL and TNF-α for 6 days to induce M cells. PBS served as controls. (C) Confocal micrographs of representative regions from mouse ALI epithelial cultures immunostained with characteristic M cell markers, SOX8 (green), CCL9 (magenta), and GP2 (gray). Nuclei are stained with Hoechst dye (blue). GP2 positive mature M cells are marked with white arrows. Scale bar, 20 μm. (D) Quantification of SOX8 positive nuclei following indicated treatments. Individual circles on the graph represent the percent of all epithelial cells that are SOX8 positive M cells in single ALI epithelial culture wells treated with the indicated cytokines. Data are presented as mean ± SD (standard deviation) of triplicate ALI cultures. ns = not significant, ***P ≤ 0.001, and ****P≤ 0.0001 by one-way ANOVA. (E) qPCR-based expression analysis of ALI epithelial cultures for the indicated M cell specific and non-canonical NF-κB pathway genes following the specified treatment conditions. Data are presented as mean ± SD of triplicate ALI epithelial cultures.

