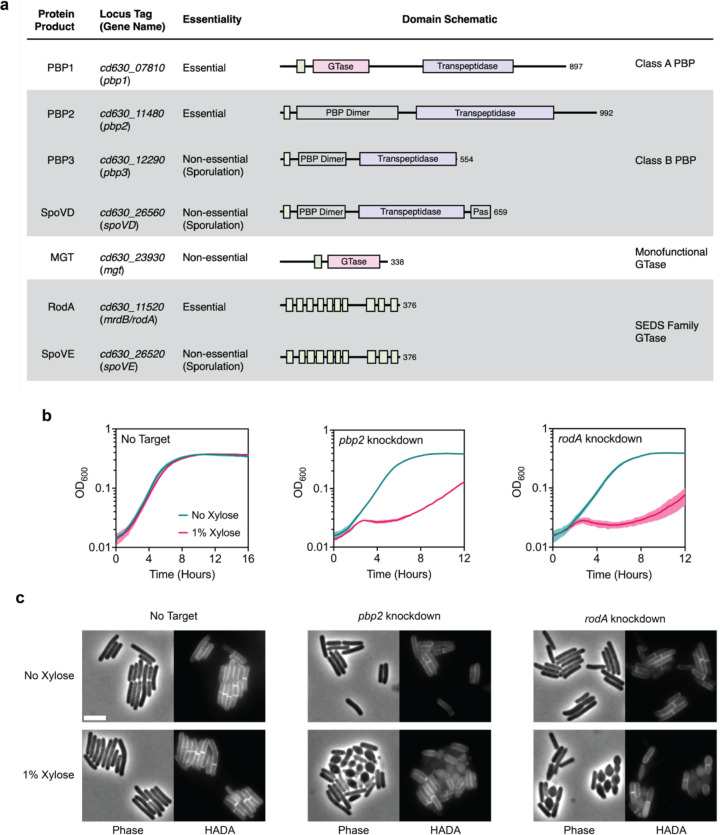
Fig. 4 |. RodA and PBP2 are involved in cell elongation.
a, Major PG synthases encoded in the C. difficile strain 630 genome. Protein domains and catalytic sites predicted using HMMER are indicated in the schematic for each protein (hmmer.org). GTase: Glycosyltransferase Domain (Pink), PBP Dimer: PBP Dimerization Domain, Pas: PASTA Domain, Transpeptidase domain (Purple). Predicted transmembrane regions are depicted as green boxes. b, Growth profiles of pbp2 and rodA CRISPRi knockdown strains compared to a no target control strain. Data are from a single growth curve experiment; mean and standard deviation plotted from three biological replicates. c, Representative micrographs showing morphological and PG incorporation phenotypes of control, pbp2, and rodA knockdown cells. PG was labeled by incubation with a fluorescent D-amino acid (HADA). Scale bar, 5 μm. Data representative of multiple independent experiments.

