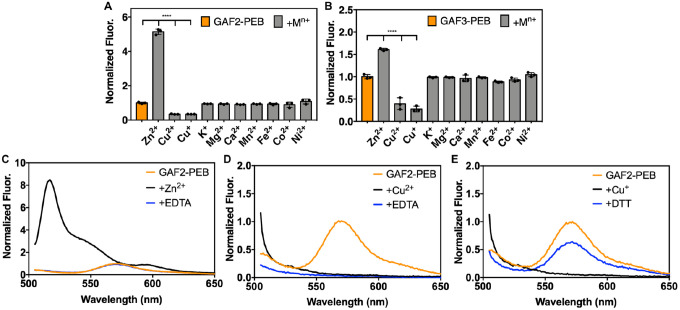
Figure 2.
Metal sensitivity and reversibility of GAF2-PEB and GAF3-PEB. A-B) To 3 μM of protein, 266 eq (800 μM K+, Mg2+, or Ca2+) or 33 eq (100 μM Zn2+, Cu2+, Cu+, Mn2+, Fe2+, Co2+, or Ni2+) metal salt was added. Data are shown as the integrated fluorescence normalized to the initial integrated fluorescence of the protein. λex = 495 nm and λem = 505–800 nm. Data were analyzed by means of one-way analysis of variance; ****p < 0.0001. Individual data points are overlaid on the bar chart representation. All error bars represent the standard deviation for three replicates. C) Fluorescence emission spectra of (His6)GAF2-PEB (3 μM) initially (orange line), upon addition of ZnCl2 (100 μM, black line), and with addition of EDTA (500 μM, blue line). D) Fluorescence emission spectra of (His6)GAF2-PEB (3 μM) initially (orange), upon addition of CuCl2 (100 μM, black), and with addition of EDTA (500 μM, blue). E) Fluorescence emission spectra of (His6)GAF2-PEB (3 μM) initially (orange), upon addition of [Cu(CH3CN)4]PF6 (100 μM, black), and with addition of DTT (200 μM, blue). Fluorescence spectra were normalized to the maximal emission intensity of GAF2-PEB at 572 nm. Buffer: 50 mM HEPES, 100 mM NaCl, pH 7.1.

