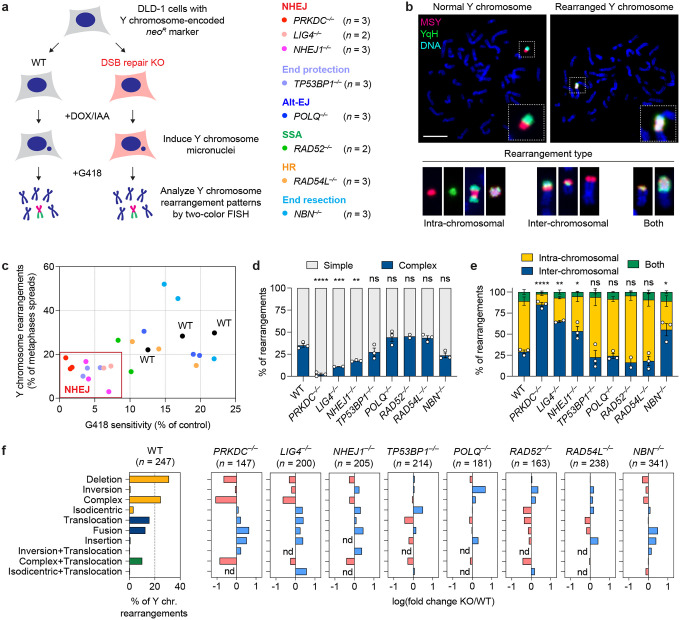
Figure 1. Genomic rearrangement landscape of mis-segregated chromosomes in the absence of specific DNA double-strand break (DSB) repair pathways.
a) Experimental approach to survey the impact of specific DSB repair pathways on chromosome rearrangements induced by micronucleus formation. Biallelic gene knockouts (KOs) were generated in the background of the CEN-SELECT system in isogenic DLD-1 cells. Y chromosome-specific mis-segregation into micronuclei and rearrangements were induced by treatment with doxycycline and auxin (DOX/IAA). b) Representative examples of metaphase spreads with normal or derivative Y chromosomes. Different types of rearrangements can be visualized by DNA fluorescence in situ hybridization (FISH) using probes targeting the euchromatic portion of the male-specific region (MSY, red) and the heterochromatic region (YqH, green) of the Y chromosome. Rearrangements were induced by 3d DOX/IAA treatment followed by G418 selection. Scale bar, 10 μm. c) Plot summarizing the effect on cell viability after G418 selection (x-axis) and rearrangement frequency of the Y chromosome (y-axis) for each DSB repair KO clone. d) Proportion of Y chromosomes exhibiting simple or complex rearrangements, as determined by metaphase FISH, following transient centromere inactivation. e) Proportion of inter- and/or intra-chromosomal rearrangements. Data in (d) and (e) represent the mean ± SEM of n = 3 independent experiments for WT, n = 2 KO clones for LIG4 and RAD52, and n = 3 KO clones for PRKDC, NHEJ1, TP53BP1, POLQ, RAD54L, and NBN; statistical analyses were calculated by ordinary one-way ANOVA test with multiple comparisons. ns, not significant; *P ≤ 0.05; **P ≤ 0.01; ***P ≤ 0.001; ****P ≤ 0.0001. f) Left: Distribution of Y chromosome rearrangement types as determined by metaphase FISH following 3d DOX/IAA treatment and G418 selection. Data are pooled from 3 independent experiments. Right: Plots depict the mean fold change in each rearrangement type as compared to WT cells. Sample sizes indicate the number of rearranged Y chromosomes examined; data are pooled from 2 or 3 individual KO clones per gene. See also Extended Data Figure 2.

