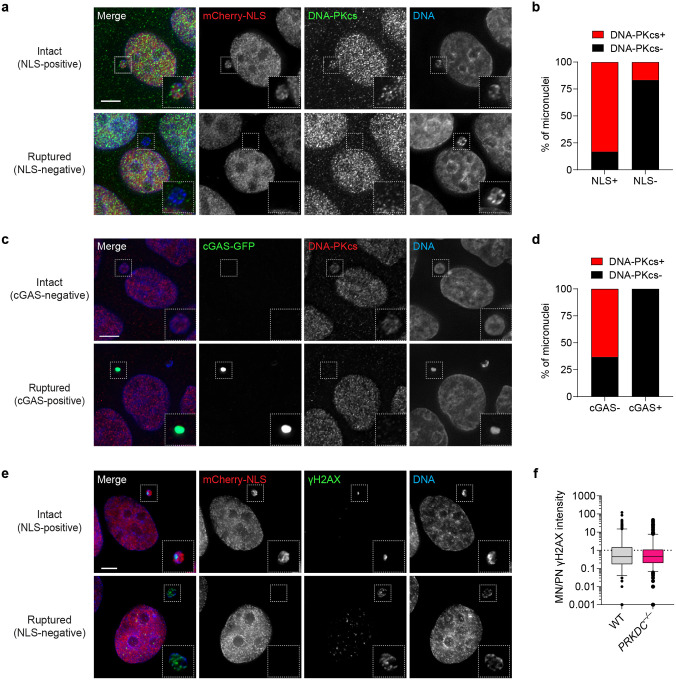
Extended Data Figure 6. Nuclear envelope rupture triggers the loss of DNA-PKcs from micronuclei.
a) Representative immunofluorescent images of DNA-PKcs in DLD-1 cells expressing mCherry fused to a nuclear localization signal (NLS) with intact (NLS-positive) or ruptured (NLS-negative) micronuclei. b) Proportion of intact and ruptured micronuclei with detectable levels of DNA-PKcs. Data represent n = 149 interphase cells with micronuclei. c) Representative immunofluorescent images of DNA-PKcs in DLD-1 cells expressing cGAS-GFP with intact (cGAS-negative) or ruptured (cGAS-positive) micronuclei. d) Proportion of intact and ruptured micronuclei with detectable levels of DNA-PKcs. Data represent n = 151 interphase cells with micronuclei. e) Representative immunofluorescent images of γH2AX in PRKDC KO DLD-1 cells expressing mCherry-NLS with intact or ruptured micronuclei. f) Fluorescence intensity of γH2AX in WT and PRKDC KO micronuclei compared to their corresponding primary nucleus. Data represent 10–90 percentile from n = 207 interphase cells with micronuclei for both WT and PRKDC KO. Scale bar for panels (a), (c), and (e), 5 μm.

