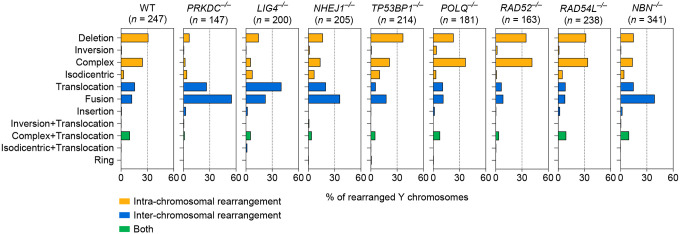
Extended Data Figure 2. Genomic rearrangement landscape of mis-segregated chromosomes following transient centromere inactivation.
Distribution of Y chromosome rearrangement types as determined by metaphase FISH following 3d DOX/IAA treatment and G418 selection. Sample sizes indicate the number of rearranged Y chromosomes examined; data are pooled from 3 independent experiments for WT cells and 2–3 independent KO clones for gene.

