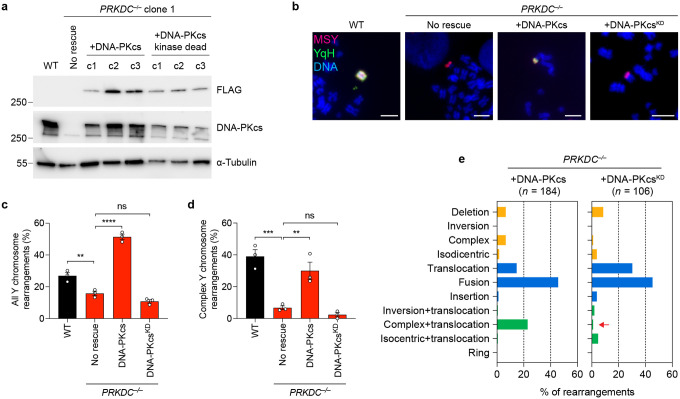
Extended Data Figure 4. Characterization of genomic rearrangements in DNA-PKcs-deficient cells.
a) Immunoblot confirmation of PRKDC KO cells expressing either FLAG-tagged WT (WT) or kinase-dead (KD) DNA-PKcs. Molecular weight markers are indicated in kilodaltons. b) Examples of Y chromosome rearrangements detected by metaphase FISH using the indicated sets of probes. Scale bar, 5 μm. c) Frequency of Y chromosome rearrangements in PRKDC KO cells complemented with WT or KD DNA-PKcs. Data are pooled from (left to right): 195, 339, 390, and 365 metaphase spreads. d) Proportion of Y chromosome rearrangements that can be classified as complex in PRKDC KO cells complemented with WT or KD DNA-PKcs. Data are pooled from (left to right): 70, 80, 184, and 106 metaphases spreads with Y chromosome rearrangements. Bar graphs in panels (c-d) represent the mean ± SEM of n = 3 independent experiments for WT and PRKDC KO, n = 3 independent DNA-PKcs rescue clones. Statistical analyses were calculated by ordinary one-way ANOVA test with multiple comparisons. ns, not significant; **P ≤ 0.001; ***P ≤ 0.001; ****P ≤ 0.0001. e) Distribution of Y chromosome rearrangement types as determined by metaphase FISH following 3d DOX/IAA treatment and G418 selection. Sample sizes indicate the number of rearranged Y chromosomes examined; data are pooled from 3 independent clones per condition.

